Opening requested calculation...
Please wait, this takes like 47 seconds. Thank you for your patience! :)
☠
0 humans have been terminated by curable diseases since this page started loading
On Who Wants to Be a Millionaire, the studio audience picked the right answer 91% of the time. The “phone a friend” expert? 65%17.
Your entire system of government is phone-a-friend. You phone 535 members of Congress who don’t know the subject, aren’t trying to answer your question, and are being paid by one of the answer choices. Then you act surprised when the answer is wrong.
The pattern is 4,297 years old: random crowds outperform credentialed experts on every question where the expert has any incentive to lie, which in government is all of them. Your species kept phoning friends anyway. On Wishonia, we built a system that asks everyone. We named it after ourselves, which your species would call “branding.”
Wishocracy replaces committees with code and representatives with math. It lets 8 billion people decide how to split contested public budgets without the answer being quietly rewritten by lobbyists, committees, or people whose main qualification is seniority. The difference between this and Congress is like asking 200 bureaucrats what you should have for lunch versus asking your stomach. Your stomach has never once funded a colleague’s lunch out of professional courtesy.
Your species is already making brutal tradeoffs. Every extra dollar for nuclear weapon systems is a dollar not spent on pragmatic clinical trials, pandemic defense, transit, housing, or anything else. Your current institutions hide that fact by slicing the budget into committees, subcommittees, and jargon until nobody can see the tradeoff clearly enough to object. Wishocracy drags it into daylight.
Regular polling is useless here because it lets people live in a fantasy where scarcity doesn’t exist. Ask humans whether they want more spending on military, healthcare, education, infrastructure, and also lower taxes, and they’ll cheerfully say yes to all of it because the poll never makes them pay for one with another. Wishocracy does. Every answer is a tradeoff under finite resources, which is why it measures budgets instead of vibes.
How Wishocracy Allocates High-Level Priorities
Anyone can submit a priority. Wishocracy allocates the part of a budget that genuinely requires a collective decision: tradeoffs across domains, shared infrastructure, and public goods that markets handle badly. It’s Kickstarter, but backed by the GDP of nations instead of your friend’s credit card.
What Wishocracy Actually Decides:
The hard stuff. Allocation across competing priorities where there is no honest price signal:
High-Level Tradeoffs
- “Nuclear weapon modernization” vs “Pragmatic clinical trials”
- “Pandemic surveillance” vs “Missile defense”
- “Warhead dismantlement verification” vs “Submarine recapitalization”
Shared Public Goods Within a Domain
- “Verification satellite network” vs “On-site inspection capacity”
- “Bridge inspection” vs “Port cybersecurity”
- “Trial matching infrastructure” vs “Research data interoperability”
Everything else is execution. Engineers build. Operators operate. Researchers research. Markets handle the parts where prices work. Wishocracy governs the part where the species has to decide what the next marginal public dollar should buy.
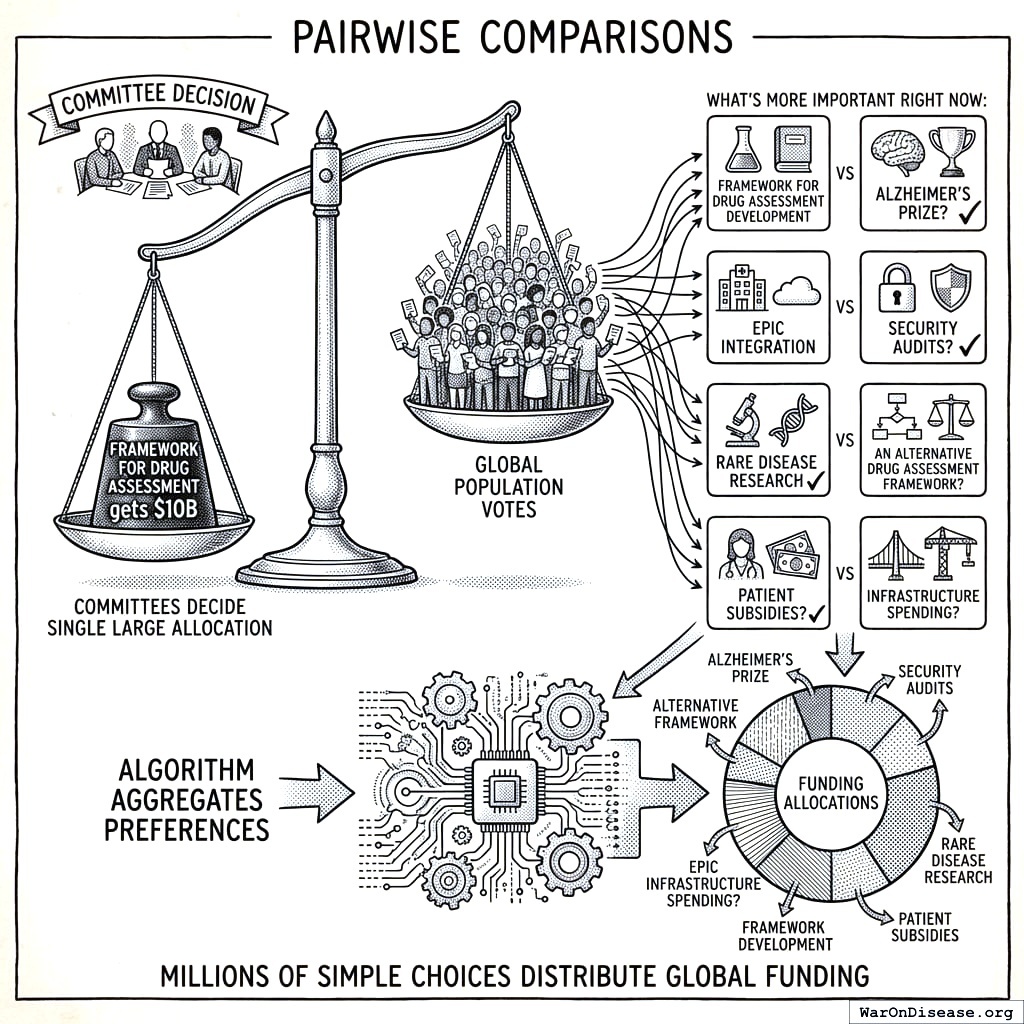
How It Works: Pairwise Slider Allocation
Your brain can’t rank a list of 20 priorities. It gives up around item number seven170. But it’s much better at a local tradeoff between two things. So instead of asking “Rank these 10,000 priorities,” the system shows you two at a time and asks:
“How would you split $100 between these two priorities right now?”
- “Nuclear weapon modernization” vs “Pragmatic clinical trials”?
- “Pandemic surveillance” vs “Missile defense”?
- “Bridge inspection” vs “Port cybersecurity”?
You drag the slider, submit your split, and do this a few times with different random pairs. It takes five minutes (less time than you spend choosing a Netflix show, and considerably more important). Millions of other people do the same. An algorithm aggregates all these pairwise allocations into funding weights. No filibustering. No horse-trading. No senators holding one priority hostage because they want a weapons plant, research park, or bridge in their district.
Not everyone answers every pair. If you don’t know enough about “pandemic surveillance vs missile defense,” skip it. A tiny minority writes Wikipedia articles, a somewhat larger minority edits them, and the majority just reads. The crowd doesn’t need everyone doing the same job. It needs enough informed people doing each job. Skipping is a feature: better to skip than inject random noise because you felt obliged to have an opinion. Low participation is a risk (the system needs thresholds and fallback modes when engagement is too thin), but letting people answer where they actually know or care beats mandatory guessing.
Individual domains keep their own allocation systems. Health has patient-directed trial participation. Science has peer review. Transit has rider feedback. Markets still handle things with prices. Wishocracy sits above that layer, steering the part that actually requires collective choice. One is the engine, the other is the steering wheel. You need both unless you enjoy driving into walls.
Why This Actually Works (Math Warning)
When millions of people make pairwise choices, something almost magical happens (by which I mean “statistically inevitable,” which is the only kind of magic that works):
- Random pairs prevent gaming. Corrupting your current system requires buying access to 535 members of Congress, which is so affordable that every major industry does it simultaneously. Corrupting Wishocracy would require bribing 8 billion random voters, and the only way to “bribe” 8 billion people is to offer them something they actually want, which is the system working correctly. The attack vector is giving people what they voted for. Your security vulnerability is democracy. It’s also immune to marketing: no ballot measure to link to, no “Vote Yes on Proposition 7” ad to run. Each voter sees random pairs, so the only way to advertise is to convince people your proposal is better than whatever it happens to be compared against, which is just… making a good argument. Your species finds this deeply unsettling.
- Independence is built in. Surowiecki identified four conditions for crowd wisdom: diversity, independence, decentralization, and aggregation17. Your elections destroy the most critical one. First-past-the-post voting forces strategic voting: people pick the “viable” candidate rather than the best one, so each ballot reflects what voters think other voters will do rather than what they actually want. It’s an ant death spiral: each ant follows the one ahead, the leader follows the last, and the whole colony walks in a circle until it dies. Pairwise comparisons can’t death-spiral. “Which matters more: pragmatic trials or nuclear modernization?” has no spoiler candidate, no wasted vote, no reason to care what your neighbor picked. You just answer honestly. When millions of people answer honestly, you get wisdom. When millions game a two-option system, you get two candidates nobody likes.
- Statistical models (Bradley-Terry, PageRank)171 extract global preferences from individual comparisons. The same math that ranks Google search results can rank humanity’s budget priorities. Google uses it to find cat videos. You’ll use it to decide whether the next marginal dollar buys a warhead or a clinical trial. Progress.
- Outliers cancel out. The guy who votes “fund my personal jetpack” gets drowned out by the millions voting for things that are at least attached to reality.
- Wisdom of crowds emerges. Remember the 91%-versus-65% gap from Millionaire? Your species already proved that random people outperform credentialed individuals at picking the right answer. Wishocracy just applies this to questions that matter.
Example with real numbers:
- 5 million people vote. Each makes 20 comparisons. That’s 100 million data points.
- Algorithm processes them in seconds.
- Output: “Allocate 27% to nuclear weapon systems, 41% to pragmatic clinical trials, 18% to pandemic defense, 14% to everything else…”
- No committee meetings were harmed in the making of this budget.
It’s democracy without the shouting. The stupidity is still there, but it’s evenly distributed across millions of people and thus cancels out. Your species calls this “the wisdom of crowds.” Mine calls it “obvious.” About half of the 847 civilizations I’ve advised adopted some version of Wishocracy. The other half voted against it, which turned out to be the last thing they voted on.
“But Direct Democracy Has Been Tried” (Yes. Badly.)
You tried asking everyone. It went poorly. But not because asking was wrong.
Your species has run four experiments in direct democracy. Each one failed for a specific, diagnosable reason. None of those reasons apply here.
Athens voted to execute Socrates and invade Sicily (which destroyed their navy and lost the Peloponnesian War). Failure mode: mob rule. Demagogues gave emotional speeches, crowds got excited, irreversible decisions happened before lunch. Wishocracy has no speeches, no candidates, no charisma. You cannot execute a philosopher with a pairwise comparison between infrastructure projects.
California propositions let voters ban same-sex marriage (Prop 8, 2008) while spending over $700 million per cycle on ballot campaigns172. Failure mode: majority rule on fundamental rights, plus unlimited advertising on binary yes/no questions. Wishocracy is scope-locked to budget allocation (you cannot vote on who gets to marry) and presents random pairs (there is no ballot measure to buy ads for).
Brexit reduced a 100-dimensional trade policy to a single binary question, then asked 33 million people to evaluate it with less information than they use to choose a phone plan173. Failure mode: voter incompetence on complex policy forced into yes/no. Wishocracy asks “pragmatic clinical trials vs. nuclear modernization,” not “leave a 27-country trade bloc: yes/no.” Pairwise comparisons between concrete tradeoffs are exactly what crowds answer well.
Swiss referendums denied women the vote until 1971 (one canton held out until 1990)174 and banned minaret construction in 2009175. Failure mode: unbounded scope. Any question could appear on the ballot, including questions about who counts as a person. But the Swiss system is also the closest working model: turnout averages 45%, decisions are granular, the country hasn’t collapsed. Wishocracy keeps the good parts (distributed decisions, regular participation) and scope-locks away the bad parts (voting on rights, 50-page ballot packets). Five minutes of pairwise comparisons, not a weekend with a legal dictionary.
Every criticism of direct democracy is actually a criticism of bad aggregation on unbounded questions. Athens: majority rule on everything with emotional manipulation. California: binary yes/no on complex policy with unlimited ad spending. Wishocracy: pairwise comparisons on scope-locked questions with no advertising surface. Same species. Different math. Different result.
Your Current System Is Phone-a-Friend (But Your Friend Is Being Bribed)
That 91%-versus-65% gap is generous to your politicians. Phone-a-friend experts have three advantages over Congress:
They’re trying to get the right answer. A senator deciding between nuclear modernization and pragmatic clinical trials is trying to get re-elected. These are different objectives. One occasionally produces a sensible budget by accident.
They’re selected for knowledge. You phone your friend who knows history for history questions. Your appropriations chair got there through 30 years of seniority and prolific fundraising. At no point did anyone check whether they could price a warhead against a clinical trial.
They’re not being paid by one of the answer choices. If the phone-a-friend expert were receiving $198 million (95% CI: $190 million-$210 million) from “Answer C,” you’d call that corruption. When a senator receives money from a military contractor and then votes on military spending, you call that “lobbying,” which is the same thing but with a syllable that makes it sound boring enough that nobody gets angry.
So your current system isn’t 65%. It’s phone-a-friend where your friend doesn’t know the subject, isn’t trying to answer your question, and is being paid to say “B.” Against that baseline, 91% seems less like a modest improvement and more like replacing a broken compass with GPS.
The 26-Point Gap Is a Floor, Not a Ceiling
Trivia is the best case for experts. One correct answer. The expert either knows it or doesn’t. Nobody is paying them to say “Constantinople” when the answer is “Istanbul.” No lobbyist taking them to dinner. Their career doesn’t depend on getting it wrong. And they still only hit 65%.
Governance is worse for experts on every dimension:
- The “right answer” requires knowledge no individual has. Friedrich Hayek won a Nobel Prize in 1974 for explaining why176. No committee knows how much the public actually values one less warhead relative to one more clinical trial. But the public does, and a system that asks all of them knows more than any committee ever could.
- Experts have financial incentives to give the wrong answer. On Millionaire, nobody pays the expert to lie. In Congress, it’s the business model.
- Experts are selected for the wrong criteria. On Millionaire, you pick your smartest friend. In Congress, the selection process optimizes for charisma, name recognition, and the ability to stand at a podium without saying anything career-ending. The overlap between this skill set and “knows which public goods deserve the next marginal dollar” is zero.
If crowds outperform experts by 26 points on questions where experts have every advantage, the gap on governance decisions (where experts are compromised, poorly selected, and missing most of the relevant information) is almost certainly larger. The 91%-versus-65% gap is the floor. The ceiling is the Soviet Union: a small group of credentialed experts making resource allocation decisions for 286 million people. It ran for 69 years. It did not go well.
Why Markets Solved This (and Why You Still Need Wishocracy)
Hayek’s solution was markets. Prices aggregate dispersed information automatically: if millions of people want more of something, the price goes up, producers make more. No committee required. Your species has been doing this for thousands of years and it works so well you barely notice it, the way you barely notice breathing until someone puts a pillow over your face.
But markets have a blind spot. They only work when someone can profit from the solution. Markets are good at shoes, mediocre at healthcare, and terrible at public goods like pandemic surveillance, arms reduction verification, and basic research infrastructure. Anything where everyone benefits but nobody can capture the return privately. Markets handle these the way your cat handles a bath.
Wishocracy is what you build when you need Hayek-style information aggregation but can’t rely on price signals. Millions of individual decisions aggregated into collective intelligence, applied to the things markets won’t touch. It’s the free market’s missing organ: the part that funds what’s important instead of just what’s profitable. Hayek diagnosed the disease in 1945. The cure is several millennia old. Better late than never.
The Free Market Proof
Wishocracy does not invent a new resource-allocation mechanism. It applies the one that already won. Free markets aggregate billions of individual decisions into prices that allocate resources more efficiently than any committee. Hayek proved this. Your supermarkets prove it every morning. Every shelf stocked with the right amount of yogurt, in the right city, at the right time, without a single committee meeting, is evidence that distributed decision-making works. The yogurt section of a grocery store is a more sophisticated information-processing system than the United States Congress, and it never once held a hearing.
The mechanism is simple: individuals make local tradeoff decisions with real stakes, an aggregation system combines them, and the result reflects distributed knowledge that no central planner could possess. Markets do this with prices. Wishocracy does this with pairwise budget comparisons. Same engine. Different fuel. The fuel changes because public goods have no price signal (you cannot buy “one unit of pandemic preparedness” on Amazon), but the engine, distributed individual decisions aggregated into collective intelligence, is identical.
So the question is not “has Wishocracy been tested?” The question is “has the free market been tested?” And the answer is: for centuries, across every economy that tried it, against every alternative. The free market is the most replicated experiment in the history of resource allocation. Wishocracy is that experiment applied to the one domain your species left out.
Your species tested central planning against free markets. Free markets won. Then you looked at government budgets and said, “Let’s use central planning for this part.” Wishocracy is the proposal to stop doing that. This is the third of three independent proofs that you should redirect resources from weapons to medicine. The other two are Wishonia’s Wager (the math demands it) and The Biotechnological Imperative (morality demands it). This one says the mechanism is proven. Three proofs, zero shared premises, same conclusion.
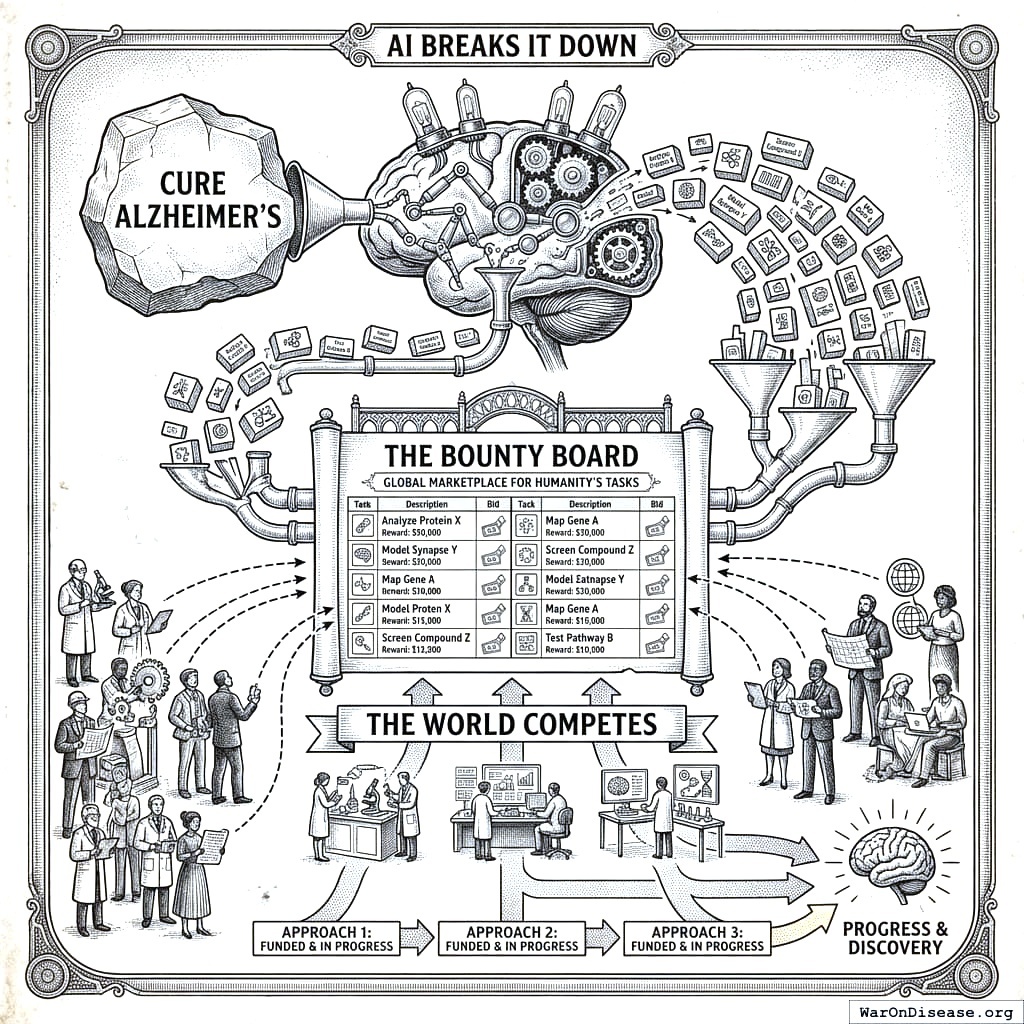
From Priorities to Projects (Where Wishes Become Tasks)
Great, so the Pairwise Slider tells you “Pragmatic clinical trials” matter more than “nuclear weapon modernization.” Now what? A priority without a plan is just a wish. Wishes don’t cure anything or dismantle anything (despite the name). Wishocracy translates that priority into action.
AI Breaks It Down: An AI takes the high-level priority and breaks it into thousands of smaller, concrete, fundable tasks. “Expand pragmatic clinical trials” becomes “Build trial matching infrastructure.” That becomes “Integrate hospital data systems.” “Build open verification tools for warhead dismantlement” becomes “Contract satellite imagery analysis.” Every impossible problem is just a series of possible steps arranged in a line. Your species figured this out for building pyramids 4,500 years ago but keeps forgetting to apply it to government.
The Bounty Board: The system posts these tasks to a global marketplace. It’s like eBay, but for whatever priority the public just chose.
- WANTED: Expand pragmatic clinical trial capacity. BOUNTY: $10 billion.
- WANTED: Build open verification tools for warhead dismantlement. BOUNTY: $500 million.
The World Competes: Teams from MIT to some kid in a garage in Lagos bid on these tasks. The system funds multiple approaches in parallel. Winners get more funding. Losers get defunded instantly. It’s venture capital for public goods. Your species already uses this method to decide which restaurants survive and which phone apps get downloaded. Time to try it with the things you keep pretending are too important for competition.
Why the Algorithm Is the Constitution
Your species writes beautiful rules and then immediately finds people to break them. Your Constitution guarantees free speech; your government classifies documents. Your laws prohibit bribery; your lobbying industry does it with a receipt. Every protection you’ve designed relies on humans to enforce it, and humans can be bought, threatened, promoted, or distracted by a sufficiently interesting scandal.
No sane civilization would try enforcement-based protections for more than 200 years before concluding that constitutional constraints enforced by people are just suggestions with better typography. So: put the protections in the math.
Algorithmic Protections (Rules Nobody Can Break Because They’re Not Rules)
Scope. The domain is defined before voting starts. An allocation ballot can ask “nuclear weapon systems or pragmatic clinical trials?” A health ballot can ask “trial matching infrastructure or research data interoperability?” It cannot ask who counts as a person, which religion gets banned, or whether your senator’s cousin deserves a bridge contract. You can’t deposit a sandwich at an ATM. The machine doesn’t accept that input.
Transparency. No backroom where a committee quietly edits the answer. All comparisons, allocations, and outputs get published. Not because a law requires it, but because the system was designed without a “hide this part” button.
Corruption resistance. Your current system can be captured by a manageable number of lobbyists bribing a manageable number of people in a manageable number of rooms. Wishocracy raises the cost dramatically. No single appropriations chair to buy. No single committee hearing to dominate. No single swing vote to purchase. Most of the money never passes through a room with a door you can close.
Bodily autonomy. You can vote to allocate budgets. You cannot vote to control someone else’s body. Not by majority vote. Not by executive order. Not by a very convincing TED talk. The shortest law any civilization needs is still: “Self.”
What Wishocracy Measures
Wishocracy measures one thing: how people want a bounded public budget split.
It doesn’t tell you whether the public is morally correct. It doesn’t prove which policy is causally optimal. It answers a narrower question: what do people actually want the next marginal public dollar to buy?
If the answer is “27 cents to nuclear weapon systems and 73 cents to pragmatic clinical trials,” that’s already more information than most elections produce after two years of campaigning, three billion dollars in ads, and a national shouting match.
1.
NIH Common Fund. NIH pragmatic trials: Minimal funding despite 30x cost advantage.
NIH Common Fund: HCS Research Collaboratory https://commonfund.nih.gov/hcscollaboratory (2025)
The NIH Pragmatic Trials Collaboratory funds trials at $500K for planning phase, $1M/year for implementation-a tiny fraction of NIH’s budget. The ADAPTABLE trial cost $14 million for 15,076 patients (= $929/patient) versus $420 million for a similar traditional RCT (30x cheaper), yet pragmatic trials remain severely underfunded. PCORnet infrastructure enables real-world trials embedded in healthcare systems, but receives minimal support compared to basic research funding. Additional sources: https://commonfund.nih.gov/hcscollaboratory | https://pcornet.org/wp-content/uploads/2025/08/ADAPTABLE_Lay_Summary_21JUL2025.pdf | https://www.ncbi.nlm.nih.gov/pmc/articles/PMC5604499/
.
2.
Cato Institute. Chance of dying from terrorism statistic.
Cato Institute: Terrorism and Immigration Risk Analysis https://www.cato.org/policy-analysis/terrorism-immigration-risk-analysis Chance of American dying in foreign-born terrorist attack: 1 in 3.6 million per year (1975-2015) Including 9/11 deaths; annual murder rate is 253x higher than terrorism death rate More likely to die from lightning strike than foreign terrorism Note: Comprehensive 41-year study shows terrorism risk is extremely low compared to everyday dangers Additional sources: https://www.cato.org/policy-analysis/terrorism-immigration-risk-analysis | https://www.nbcnews.com/news/us-news/you-re-more-likely-die-choking-be-killed-foreign-terrorists-n715141
.
3.
NIH. Antidepressant clinical trial exclusion rates.
Zimmerman et al. https://pubmed.ncbi.nlm.nih.gov/26276679/ (2015)
Mean exclusion rate: 86.1% across 158 antidepressant efficacy trials (range: 44.4% to 99.8%) More than 82% of real-world depression patients would be ineligible for antidepressant registration trials Exclusion rates increased over time: 91.4% (2010-2014) vs. 83.8% (1995-2009) Most common exclusions: comorbid psychiatric disorders, age restrictions, insufficient depression severity, medical conditions Emergency psychiatry patients: only 3.3% eligible (96.7% excluded) when applying 9 common exclusion criteria Only a minority of depressed patients seen in clinical practice are likely to be eligible for most AETs Note: Generalizability of antidepressant trials has decreased over time, with increasingly stringent exclusion criteria eliminating patients who would actually use the drugs in clinical practice Additional sources: https://pubmed.ncbi.nlm.nih.gov/26276679/ | https://pubmed.ncbi.nlm.nih.gov/26164052/ | https://www.wolterskluwer.com/en/news/antidepressant-trials-exclude-most-real-world-patients-with-depression
.
4.
CNBC. Warren buffett’s career average investment return.
CNBC https://www.cnbc.com/2025/05/05/warren-buffetts-return-tally-after-60-years-5502284percent.html (2025)
Berkshire’s compounded annual return from 1965 through 2024 was 19.9%, nearly double the 10.4% recorded by the S&P 500. Berkshire shares skyrocketed 5,502,284% compared to the S&P 500’s 39,054% rise during that period. Additional sources: https://www.cnbc.com/2025/05/05/warren-buffetts-return-tally-after-60-years-5502284percent.html | https://www.slickcharts.com/berkshire-hathaway/returns
.
5.
World Health Organization. WHO global health estimates 2024.
World Health Organization https://www.who.int/data/gho/data/themes/mortality-and-global-health-estimates (2024)
Comprehensive mortality and morbidity data by cause, age, sex, country, and year Global mortality: 55-60 million deaths annually Lives saved by modern medicine (vaccines, cardiovascular drugs, oncology): 12M annually (conservative aggregate) Leading causes of death: Cardiovascular disease (17.9M), Cancer (10.3M), Respiratory disease (4.0M) Note: Baseline data for regulatory mortality analysis. Conservative estimate of pharmaceutical impact based on WHO immunization data (4.5M/year from vaccines) + cardiovascular interventions (3.3M/year) + oncology (1.5M/year) + other therapies. Additional sources: https://www.who.int/data/gho/data/themes/mortality-and-global-health-estimates
.
6.
GiveWell. GiveWell cost per life saved for top charities (2024).
GiveWell: Top Charities https://www.givewell.org/charities/top-charities General range: $3,000-$5,500 per life saved (GiveWell top charities) Helen Keller International (Vitamin A): $3,500 average (2022-2024); varies $1,000-$8,500 by country Against Malaria Foundation: $5,500 per life saved New Incentives (vaccination incentives): $4,500 per life saved Malaria Consortium (seasonal malaria chemoprevention): $3,500 per life saved VAS program details: $2 to provide vitamin A supplements to child for one year Note: Figures accurate for 2024. Helen Keller VAS program has wide country variation ($1K-$8.5K) but $3,500 is accurate average. Among most cost-effective interventions globally Additional sources: https://www.givewell.org/charities/top-charities | https://www.givewell.org/charities/helen-keller-international | https://ourworldindata.org/cost-effectiveness
.
7.
U.S. Department of Defense.
5.56mm NATO ammunition bulk procurement pricing. (2024)
The cost of 5.56mm NATO ammunition at military bulk procurement rates is approximately $0.40 per round, based on Lake City Army Ammunition Plant production and commercial market floor prices for mil-spec M855 ammunition.
8.
Pike, J.
U.s. Forces fire 250,000 rounds for every insurgent killed. (2011)
The General Accounting Office reports that US forces used 1.8 billion rounds of small-arms ammunition per year, a level that more than doubled in five years. An estimated 250,000 rounds were fired for every insurgent killed in Iraq and Afghanistan.
9.
AARP. Unpaid caregiver hours and economic value.
AARP 2023 https://www.aarp.org/caregiving/financial-legal/info-2023/unpaid-caregivers-provide-billions-in-care.html (2023)
Average family caregiver: 25-26 hours per week (100-104 hours per month) 38 million caregivers providing 36 billion hours of care annually Economic value: $16.59 per hour = $600 billion total annual value (2021) 28% of people provided eldercare on a given day, averaging 3.9 hours when providing care Caregivers living with care recipient: 37.4 hours per week Caregivers not living with recipient: 23.7 hours per week Note: Disease-related caregiving is subset of total; includes elderly care, disability care, and child care Additional sources: https://www.aarp.org/caregiving/financial-legal/info-2023/unpaid-caregivers-provide-billions-in-care.html | https://www.bls.gov/news.release/elcare.nr0.htm | https://www.caregiver.org/resource/caregiver-statistics-demographics/
.
11.
Forbes.
Forbes world’s billionaires list 2024. (2024)
Forbes identified a record 2,781 billionaires worldwide with combined net worth of $14.2 trillion, 141 more than 2023. Bernard Arnault (LVMH) topped the list at $233 billion.
12.
CDC MMWR. Childhood vaccination economic benefits.
CDC MMWR https://www.cdc.gov/mmwr/volumes/73/wr/mm7331a2.htm (1994)
US programs (1994-2023): $540B direct savings, $2.7T societal savings ( $18B/year direct, $90B/year societal) Global (2001-2020): $820B value for 10 diseases in 73 countries ( $41B/year) ROI: $11 return per $1 invested Measles vaccination alone saved 93.7M lives (61% of 154M total) over 50 years (1974-2024) Additional sources: https://www.cdc.gov/mmwr/volumes/73/wr/mm7331a2.htm | https://www.thelancet.com/journals/lancet/article/PIIS0140-6736(24)00850-X/fulltext
.
16.
U.S. Bureau of Labor Statistics.
CPI inflation calculator. (2024)
CPI-U (1980): 82.4 CPI-U (2024): 313.5 Inflation multiplier (1980-2024): 3.80× Cumulative inflation: 280.48% Average annual inflation rate: 3.08% Note: Official U.S. government inflation data using Consumer Price Index for All Urban Consumers (CPI-U). Additional sources: https://www.bls.gov/data/inflation_calculator.htm
.
17.
James Surowiecki.
The Wisdom of Crowds. (Surowiecki, 2004).
Explores the aggregation of information in groups, arguing that decisions are often better than could have been made by any single member of the group. The opening anecdote relates Francis Galton’s surprise that the crowd at a county fair accurately guessed the weight of an ox when the median of their individual guesses was taken. The three conditions for a group to be intelligent are diversity, independence, and decentralization. Additional sources: https://archive.org/details/wisdomofcrowds0000suro | https://en.wikipedia.org/wiki/The_Wisdom_of_Crowds | https://www.amazon.com/Wisdom-Crowds-James-Surowiecki/dp/0385721706
.
18.
ClinicalTrials.gov API v2 direct analysis. ClinicalTrials.gov cumulative enrollment data (2025).
Direct analysis via ClinicalTrials.gov API v2 https://clinicaltrials.gov/data-api/api Analysis of 100,000 active/recruiting/completed trials on ClinicalTrials.gov (as of January 2025) shows cumulative enrollment of 12.2 million participants: Phase 1 (722k), Phase 2 (2.2M), Phase 3 (6.5M), Phase 4 (2.7M). Median participants per trial: Phase 1 (33), Phase 2 (60), Phase 3 (237), Phase 4 (90). Additional sources: https://clinicaltrials.gov/data-api/api
.
19.
ACS CAN. Clinical trial patient participation rate.
ACS CAN: Barriers to Clinical Trial Enrollment https://www.fightcancer.org/policy-resources/barriers-patient-enrollment-therapeutic-clinical-trials-cancer Only 3-5% of adult cancer patients in US receive treatment within clinical trials About 5% of American adults have ever participated in any clinical trial Oncology: 2-3% of all oncology patients participate Contrast: 50-60% enrollment for pediatric cancer trials (<15 years old) Note: 20% of cancer trials fail due to insufficient enrollment; 11% of research sites enroll zero patients Additional sources: https://www.fightcancer.org/policy-resources/barriers-patient-enrollment-therapeutic-clinical-trials-cancer | https://hints.cancer.gov/docs/Briefs/HINTS_Brief_48.pdf
.
20.
ScienceDaily. Global prevalence of chronic disease.
ScienceDaily: GBD 2015 Study https://www.sciencedaily.com/releases/2015/06/150608081753.htm (2015)
2.3 billion individuals had more than five ailments (2013) Chronic conditions caused 74% of all deaths worldwide (2019), up from 67% (2010) Approximately 1 in 3 adults suffer from multiple chronic conditions (MCCs) Risk factor exposures: 2B exposed to biomass fuel, 1B to air pollution, 1B smokers Projected economic cost: $47 trillion by 2030 Note: 2.3B with 5+ ailments is more accurate than "2B with chronic disease." One-third of all adults globally have multiple chronic conditions Additional sources: https://www.sciencedaily.com/releases/2015/06/150608081753.htm | https://pmc.ncbi.nlm.nih.gov/articles/PMC10830426/ | https://pmc.ncbi.nlm.nih.gov/articles/PMC6214883/
.
21.
C&EN. Annual number of new drugs approved globally: 50.
C&EN https://cen.acs.org/pharmaceuticals/50-new-drugs-received-FDA/103/i2 (2025)
50 new drugs approved annually Additional sources: https://cen.acs.org/pharmaceuticals/50-new-drugs-received-FDA/103/i2 | https://www.fda.gov/drugs/development-approval-process-drugs/novel-drug-approvals-fda
.
22.
Williams, R. J., Tse, T., DiPiazza, K. & Zarin, D. A.
Terminated trials in the ClinicalTrials.gov results database: Evaluation of availability of primary outcome data and reasons for termination.
PLOS One 10, e0127242 (2015)
Approximately 12% of trials with results posted on the ClinicalTrials.gov results database (905/7,646) were terminated. Primary reasons: insufficient accrual (57% of non-data-driven terminations), business/strategic reasons, and efficacy/toxicity findings (21% data-driven terminations).
25.
OpenSecrets. Defense sector lobbying summary.
OpenSecrets https://www.opensecrets.org/federal-lobbying/sectors/summary?id=D (2025)
Military sector federal lobbying totaled $198,009,793 in 2025, up from $159.5 million in 2024 and $142.9 million in 2023. Additional sources: https://www.opensecrets.org/federal-lobbying/sectors/summary?id=D
.
26.
Companies Market Cap.
BAE systems and thales market capitalization. (2026)
BAE Systems market capitalization approx $75.80B and Thales approx $56.68B as of June 2026, combined approx $132.5B for the two major allied European military primes. Additional sources: https://companiesmarketcap.com/thales/marketcap/
.
27.
Stock Analysis.
Military prime contractor market capitalization and float statistics. (2026)
Combined market capitalization of 11 US military primes approx $835.8B at the 2026-06-11 close: RTX $248.07B, Boeing $174.71B, Lockheed Martin $126.51B, General Dynamics $96.90B, Northrop Grumman $78.48B, L3Harris $58.16B, Leidos $15.36B, Huntington Ingalls $11.86B, CACI $11.61B, Booz Allen Hamilton $9.24B, SAIC $4.86B. Tradeable float across the 13 Western primes (adding BAE Systems and Thales) approx $880B, about 91 percent of combined cap (range $850-900B), from per-company float and shares-outstanding statistics pages; big-5 floats verified individually (RTX 92.6%, BA 96.0%, LMT 85.7%, GD 94.2%, NOC 99.7%); Thales is the outlier at approx 45% float because the French State (26.60%) and Dassault Aviation (26.59%) stakes are locked. Additional sources: https://stockanalysis.com/stocks/rtx/statistics/ | https://www.dassault-aviation.com/en/group/about-us/shareholding-structure-and-organization-chart/
.
28.
Rummel, R. J.
Death by Government: Genocide and Mass Murder Since 1900. (Transaction Publishers, 1994).
Political scientist R.J. Rummel’s comprehensive accounting of democide (government murder of unarmed civilians) in the 20th century. His final revised estimate: 262 million people murdered by their own governments from 1900-1999, excluding battle deaths in wars. Range: 200-272+ million. Communist regimes account for the largest share (100-148+ million). Updated figures at hawaii.edu/powerkills.
29.
GiveWell. Cost per DALY for deworming programs.
https://www.givewell.org/international/technical/programs/deworming/cost-effectiveness Schistosomiasis treatment: $28.19-$70.48 per DALY (using arithmetic means with varying disability weights) Soil-transmitted helminths (STH) treatment: $82.54 per DALY (midpoint estimate) Note: GiveWell explicitly states this 2011 analysis is "out of date" and their current methodology focuses on long-term income effects rather than short-term health DALYs Additional sources: https://www.givewell.org/international/technical/programs/deworming/cost-effectiveness
.
30.
Calculated from IHME Global Burden of Disease (2.55B DALYs) and global GDP per capita valuation. $109 trillion annual global disease burden.
The global economic burden of disease, including direct healthcare costs ($8.2 trillion) and lost productivity ($100.9 trillion from 2.55 billion DALYs × $39,570 per DALY), totals approximately $109.1 trillion annually.
32.
Think by Numbers. Pre-1962 drug development costs and timeline (think by numbers).
Think by Numbers: How Many Lives Does FDA Save? https://thinkbynumbers.org/health/how-many-net-lives-does-the-fda-save/ (1962)
Historical estimates (1970-1985): USD $226M fully capitalized (2011 prices) 1980s drugs: $65M after-tax R&D (1990 dollars), $194M compounded to approval (1990 dollars) Modern comparison: $2-3B costs, 7-12 years (dramatic increase from pre-1962) Context: 1962 regulatory clampdown reduced new treatment production by 70%, dramatically increasing development timelines and costs Note: Secondary source; less reliable than Congressional testimony Additional sources: https://thinkbynumbers.org/health/how-many-net-lives-does-the-fda-save/ | https://en.wikipedia.org/wiki/Cost_of_drug_development | https://www.statnews.com/2018/10/01/changing-1962-law-slash-drug-prices/
.
33.
Biotechnology Innovation Organization (BIO). BIO clinical development success rates 2011-2020.
Biotechnology Innovation Organization (BIO) https://go.bio.org/rs/490-EHZ-999/images/ClinicalDevelopmentSuccessRates2011_2020.pdf (2021)
Phase I duration: 2.3 years average Total time to market (Phase I-III + approval): 10.5 years average Phase transition success rates: Phase I→II: 63.2%, Phase II→III: 30.7%, Phase III→Approval: 58.1% Overall probability of approval from Phase I: 12% Note: Largest publicly available study of clinical trial success rates. Efficacy lag = 10.5 - 2.3 = 8.2 years post-safety verification. Additional sources: https://go.bio.org/rs/490-EHZ-999/images/ClinicalDevelopmentSuccessRates2011_2020.pdf
.
34.
Nature Medicine. Drug repurposing rate ( 30%).
Nature Medicine https://www.nature.com/articles/s41591-024-03233-x (2024)
Approximately 30% of drugs gain at least one new indication after initial approval. Additional sources: https://www.nature.com/articles/s41591-024-03233-x
.
35.
EPI. Education investment economic multiplier (2.1).
EPI: Public Investments Outside Core Infrastructure https://www.epi.org/publication/bp348-public-investments-outside-core-infrastructure/ Early childhood education: Benefits 12X outlays by 2050; $8.70 per dollar over lifetime Educational facilities: $1 spent → $1.50 economic returns Energy efficiency comparison: 2-to-1 benefit-to-cost ratio (McKinsey) Private return to schooling: 9% per additional year (World Bank meta-analysis) Note: 2.1 multiplier aligns with benefit-to-cost ratios for educational infrastructure/energy efficiency. Early childhood education shows much higher returns (12X by 2050) Additional sources: https://www.epi.org/publication/bp348-public-investments-outside-core-infrastructure/ | https://documents1.worldbank.org/curated/en/442521523465644318/pdf/WPS8402.pdf | https://freopp.org/whitepapers/establishing-a-practical-return-on-investment-framework-for-education-and-skills-development-to-expand-economic-opportunity/
.
36.
PMC. Healthcare investment economic multiplier (1.8).
PMC: California Universal Health Care https://pmc.ncbi.nlm.nih.gov/articles/PMC5954824/ (2022)
Healthcare fiscal multiplier: 4.3 (95% CI: 2.5-6.1) during pre-recession period (1995-2007) Overall government spending multiplier: 1.61 (95% CI: 1.37-1.86) Why healthcare has high multipliers: No effect on trade deficits (spending stays domestic); improves productivity & competitiveness; enhances long-run potential output Gender-sensitive fiscal spending (health & care economy) produces substantial positive growth impacts Note: "1.8" appears to be conservative estimate; research shows healthcare multipliers of 4.3 Additional sources: https://pmc.ncbi.nlm.nih.gov/articles/PMC5954824/ | https://cepr.org/voxeu/columns/government-investment-and-fiscal-stimulus | https://ncbi.nlm.nih.gov/pmc/articles/PMC3849102/ | https://set.odi.org/wp-content/uploads/2022/01/Fiscal-multipliers-review.pdf
.
37.
World Bank. Infrastructure investment economic multiplier (1.6).
World Bank: Infrastructure Investment as Stimulus https://blogs.worldbank.org/en/ppps/effectiveness-infrastructure-investment-fiscal-stimulus-what-weve-learned (2022)
Infrastructure fiscal multiplier: 1.6 during contractionary phase of economic cycle Average across all economic states: 1.5 (meaning $1 of public investment → $1.50 of economic activity) Time horizon: 0.8 within 1 year, 1.5 within 2-5 years Range of estimates: 1.5-2.0 (following 2008 financial crisis & American Recovery Act) Italian public construction: 1.5-1.9 multiplier US ARRA: 0.4-2.2 range (differential impacts by program type) Economic Policy Institute: Uses 1.6 for infrastructure spending (middle range of estimates) Note: Public investment less likely to crowd out private activity during recessions; particularly effective when monetary policy loose with near-zero rates Additional sources: https://blogs.worldbank.org/en/ppps/effectiveness-infrastructure-investment-fiscal-stimulus-what-weve-learned | https://www.gihub.org/infrastructure-monitor/insights/fiscal-multiplier-effect-of-infrastructure-investment/ | https://cepr.org/voxeu/columns/government-investment-and-fiscal-stimulus | https://www.richmondfed.org/publications/research/economic_brief/2022/eb_22-04
.
38.
Mercatus. Military spending economic multiplier (0.6).
Mercatus: Defense Spending and Economy https://www.mercatus.org/research/research-papers/defense-spending-and-economy Ramey (2011): 0.6 short-run multiplier Barro (1981): 0.6 multiplier for WWII spending (war spending crowded out 40¢ private economic activity per federal dollar) Barro & Redlick (2011): 0.4 within current year, 0.6 over two years; increased govt spending reduces private-sector GDP portions General finding: $1 increase in deficit-financed federal military spending = less than $1 increase in GDP Variation by context: Central/Eastern European NATO: 0.6 on impact, 1.5-1.6 in years 2-3, gradual fall to zero Ramey & Zubairy (2018): Cumulative 1% GDP increase in military expenditure raises GDP by 0.7% Additional sources: https://www.mercatus.org/research/research-papers/defense-spending-and-economy | https://cepr.org/voxeu/columns/world-war-ii-america-spending-deficits-multipliers-and-sacrifice | https://www.rand.org/content/dam/rand/pubs/research_reports/RRA700/RRA739-2/RAND_RRA739-2.pdf
.
40.
FDA. FDA-approved prescription drug products (20,000+).
FDA https://www.fda.gov/media/143704/download There are over 20,000 prescription drug products approved for marketing. Additional sources: https://www.fda.gov/media/143704/download
.
43.
ACLED. Active combat deaths annually.
ACLED: Global Conflict Surged 2024 https://acleddata.com/2024/12/12/data-shows-global-conflict-surged-in-2024-the-washington-post/ (2024)
2024: 233,597 deaths (30% increase from 179,099 in 2023) Deadliest conflicts: Ukraine (67,000), Palestine (35,000) Nearly 200,000 acts of violence (25% higher than 2023, double from 5 years ago) One in six people globally live in conflict-affected areas Additional sources: https://acleddata.com/2024/12/12/data-shows-global-conflict-surged-in-2024-the-washington-post/ | https://acleddata.com/media-citation/data-shows-global-conflict-surged-2024-washington-post | https://acleddata.com/conflict-index/index-january-2024/
.
44.
UCDP. State violence deaths annually.
UCDP: Uppsala Conflict Data Program https://ucdp.uu.se/ Uppsala Conflict Data Program (UCDP): Tracks one-sided violence (organized actors attacking unarmed civilians) UCDP definition: Conflicts causing at least 25 battle-related deaths in calendar year 2023 total organized violence: 154,000 deaths; Non-state conflicts: 20,900 deaths UCDP collects data on state-based conflicts, non-state conflicts, and one-sided violence Specific "2,700 annually" figure for state violence not found in recent UCDP data; actual figures vary annually Additional sources: https://ucdp.uu.se/ | https://en.wikipedia.org/wiki/Uppsala_Conflict_Data_Program | https://ourworldindata.org/grapher/deaths-in-armed-conflicts-by-region
.
45.
Our World in Data. Terror attack deaths (8,300 annually).
Our World in Data: Terrorism https://ourworldindata.org/terrorism (2024)
2023: 8,352 deaths (22% increase from 2022, highest since 2017) 2023: 3,350 terrorist incidents (22% decrease), but 56% increase in avg deaths per attack Global Terrorism Database (GTD): 200,000+ terrorist attacks recorded (2021 version) Maintained by: National Consortium for Study of Terrorism & Responses to Terrorism (START), U. of Maryland Geographic shift: Epicenter moved from Middle East to Central Sahel (sub-Saharan Africa) - now >50% of all deaths Additional sources: https://ourworldindata.org/terrorism | https://reliefweb.int/report/world/global-terrorism-index-2024 | https://www.start.umd.edu/gtd/ | https://ourworldindata.org/grapher/fatalities-from-terrorism
.
46.
Institute for Health Metrics and Evaluation (IHME). IHME global burden of disease 2021 (2.88B DALYs, 1.13B YLD).
Institute for Health Metrics and Evaluation (IHME) https://vizhub.healthdata.org/gbd-results/ (2024)
In 2021, global DALYs totaled approximately 2.88 billion, comprising 1.75 billion Years of Life Lost (YLL) and 1.13 billion Years Lived with Disability (YLD). This represents a 13% increase from 2019 (2.55B DALYs), largely attributable to COVID-19 deaths and aging populations. YLD accounts for approximately 39% of total DALYs, reflecting the substantial burden of non-fatal chronic conditions. Additional sources: https://vizhub.healthdata.org/gbd-results/ | https://www.thelancet.com/journals/lancet/article/PIIS0140-6736(24)00757-8/fulltext | https://www.healthdata.org/research-analysis/about-gbd
.
47.
Costs of War Project, Brown University Watson Institute. Environmental cost of war ($100B annually).
Brown Watson Costs of War: Environmental Cost https://watson.brown.edu/costsofwar/costs/social/environment War on Terror emissions: 1.2B metric tons GHG (equivalent to 257M cars/year) Military: 5.5% of global GHG emissions (2X aviation + shipping combined) US DoD: World’s single largest institutional oil consumer, 47th largest emitter if nation Cleanup costs: $500B+ for military contaminated sites Gaza war environmental damage: $56.4B; landmine clearance: $34.6B expected Climate finance gap: Rich nations spend 30X more on military than climate finance Note: Military activities cause massive environmental damage through GHG emissions, toxic contamination, and long-term cleanup costs far exceeding current climate finance commitments Additional sources: https://watson.brown.edu/costsofwar/costs/social/environment | https://earth.org/environmental-costs-of-wars/ | https://transformdefence.org/transformdefence/stats/
.
48.
ScienceDaily. Medical research lives saved annually (4.2 million).
ScienceDaily: Physical Activity Prevents 4M Deaths https://www.sciencedaily.com/releases/2020/06/200617194510.htm (2020)
Physical activity: 3.9M early deaths averted annually worldwide (15% lower premature deaths than without) COVID vaccines (2020-2024): 2.533M deaths averted, 14.8M life-years preserved; first year alone: 14.4M deaths prevented Cardiovascular prevention: 3 interventions could delay 94.3M deaths over 25 years (antihypertensives alone: 39.4M) Pandemic research response: Millions of deaths averted through rapid vaccine/drug development Additional sources: https://www.sciencedaily.com/releases/2020/06/200617194510.htm | https://pmc.ncbi.nlm.nih.gov/articles/PMC9537923/ | https://www.ahajournals.org/doi/10.1161/CIRCULATIONAHA.118.038160 | https://pmc.ncbi.nlm.nih.gov/articles/PMC9464102/
.
49.
SIPRI. 36:1 disparity ratio of spending on weapons over cures.
SIPRI: Military Spending https://www.sipri.org/commentary/blog/2016/opportunity-cost-world-military-spending (2016)
Global military spending: $2.7 trillion (2024, SIPRI) Global government medical research: $68 billion (2024) Actual ratio: 39.7:1 in favor of weapons over medical research Military R&D alone: $85B (2004 data, 10% of global R&D) Military spending increases crowd out health: 1% ↑ military = 0.62% ↓ health spending Note: Ratio actually worse than 36:1. Each 1% increase in military spending reduces health spending by 0.62%, with effect more intense in poorer countries (0.962% reduction) Additional sources: https://www.sipri.org/commentary/blog/2016/opportunity-cost-world-military-spending | https://pmc.ncbi.nlm.nih.gov/articles/PMC9174441/ | https://www.congress.gov/crs-product/R45403
.
50.
Think by Numbers. Lost human capital due to war ($270B annually).
Think by Numbers https://thinkbynumbers.org/military/war/the-economic-case-for-peace-a-comprehensive-financial-analysis/ (2021)
Lost human capital from war: $300B annually (economic impact of losing skilled/productive individuals to conflict) Broader conflict/violence cost: $14T/year globally 1.4M violent deaths/year; conflict holds back economic development, causes instability, widens inequality, erodes human capital 2002: 48.4M DALYs lost from 1.6M violence deaths = $151B economic value (2000 USD) Economic toll includes: commodity prices, inflation, supply chain disruption, declining output, lost human capital Additional sources: https://thinkbynumbers.org/military/war/the-economic-case-for-peace-a-comprehensive-financial-analysis/ | https://www.weforum.org/stories/2021/02/war-violence-costs-each-human-5-a-day/ | https://pubmed.ncbi.nlm.nih.gov/19115548/
.
51.
PubMed. Psychological impact of war cost ($100B annually).
PubMed: Economic Burden of PTSD https://pubmed.ncbi.nlm.nih.gov/35485933/ PTSD economic burden (2018 U.S.): $232.2B total ($189.5B civilian, $42.7B military) Civilian costs driven by: Direct healthcare ($66B), unemployment ($42.7B) Military costs driven by: Disability ($17.8B), direct healthcare ($10.1B) Exceeds costs of other mental health conditions (anxiety, depression) War-exposed populations: 2-3X higher rates of anxiety, depression, PTSD; women and children most vulnerable Note: Actual burden $232B, significantly higher than "$100B" claimed Additional sources: https://pubmed.ncbi.nlm.nih.gov/35485933/ | https://news.va.gov/103611/study-national-economic-burden-of-ptsd-staggering/ | https://pmc.ncbi.nlm.nih.gov/articles/PMC9957523/
.
52.
CGDev. UNHCR average refugee support cost.
CGDev https://www.cgdev.org/blog/costs-hosting-refugees-oecd-countries-and-why-uk-outlier (2024)
The average cost of supporting a refugee is $1,384 per year. This represents total host country costs (housing, healthcare, education, security). OECD countries average $6,100 per refugee (mean 2022-2023), with developing countries spending $700-1,000. Global weighted average of $1,384 is reasonable given that 75-85% of refugees are in low/middle-income countries. Additional sources: https://www.cgdev.org/blog/costs-hosting-refugees-oecd-countries-and-why-uk-outlier | https://www.unhcr.org/sites/default/files/2024-11/UNHCR-WB-global-cost-of-refugee-inclusion-in-host-country-health-systems.pdf
.
53.
World Bank. World bank trade disruption cost from conflict.
World Bank https://www.worldbank.org/en/topic/trade/publication/trading-away-from-conflict Estimated $616B annual cost from conflict-related trade disruption. World Bank research shows civil war costs an average developing country 30 years of GDP growth, with 20 years needed for trade to return to pre-war levels. Trade disputes analysis shows tariff escalation could reduce global exports by up to $674 billion. Additional sources: https://www.worldbank.org/en/topic/trade/publication/trading-away-from-conflict | https://www.nber.org/papers/w11565 | http://blogs.worldbank.org/en/trade/impacts-global-trade-and-income-current-trade-disputes
.
54.
VA. Veteran healthcare cost projections.
VA https://department.va.gov/wp-content/uploads/2025/06/2026-Budget-in-Brief.pdf (2026)
VA budget: $441.3B requested for FY 2026 (10% increase). Disability compensation: $165.6B in FY 2024 for 6.7M veterans. PACT Act projected to increase spending by $300B between 2022-2031. Costs under Toxic Exposures Fund: $20B (2024), $30.4B (2025), $52.6B (2026). Additional sources: https://department.va.gov/wp-content/uploads/2025/06/2026-Budget-in-Brief.pdf | https://www.cbo.gov/publication/45615 | https://www.legion.org/information-center/news/veterans-healthcare/2025/june/va-budget-tops-400-billion-for-2025-from-higher-spending-on-mandated-benefits-medical-care
.
57.
Cybersecurity Ventures. Cybercrime economy projected to reach $10.5 trillion.
Cybersecurity Ventures: $10.5T Cybercrime https://cybersecurityventures.com/hackerpocalypse-cybercrime-report-2016/ (2016)
Global cybercrime costs: $3T (2015) → $6T (2021) → $10.5T (2025 projected) 15% annual growth rate If measured as country, would be 3rd largest economy after US and China Greatest transfer of economic wealth in history Note: More profitable than global trade of all major illegal drugs combined. Includes data theft, productivity loss, IP theft, fraud Additional sources: <https://cybersecurityventures.com/hackerpocalypse-cybercrime-report-2016/> | https://www.boisestate.edu/cybersecurity/2022/06/16/cybercrime-to-cost-the-world-10-5-trillion-annually-by-2025/
.
59.
Bolt, J. & Zanden, J. L. van.
Maddison project database 2020. (2020)
Historical GDP per capita estimates from year 1 to present. Global GDP per capita in 1900: approximately 1,260 in 1990 international dollars (roughly 3,150 in 2024 USD after PPP and inflation adjustment). Standard reference for long-run comparative economic history.
60.
Applied Clinical Trials. Global government spending on interventional clinical trials: $3-6 billion/year.
Applied Clinical Trials https://www.appliedclinicaltrialsonline.com/view/sizing-clinical-research-market Estimated range based on NIH ( $0.8-5.6B), NIHR ($1.6B total budget), and EU funding ( $1.3B/year). Roughly 5-10% of global market. Additional sources: https://www.appliedclinicaltrialsonline.com/view/sizing-clinical-research-market | https://www.thelancet.com/journals/langlo/article/PIIS2214-109X(20)30357-0/fulltext
.
65.
United Nations Department of Economic and Social Affairs, Population Division.
World population prospects 2024: Summary of results. (2024)
The 2024 Revision of the World Population Prospects provides population estimates and projections for 237 countries or areas. Global median age approximately 30.5 years in 2024, reflecting population-weighted average across all regions.
68.
Estimated from major foundation budgets and activities. Nonprofit clinical trial funding estimate.
Nonprofit foundations spend an estimated $2-5 billion annually on clinical trials globally, representing approximately 2-5% of total clinical trial spending.
69.
ICAN. Global nuclear weapon maintenance cost: $100 billion/year.
ICAN: Global Spending $100B 2024 https://www.icanw.org/global_spending_on_nuclear_weapons_topped_100_billion_in_2024 (2024)
2024: >$100 billion ($190,151/minute) - 11% increase ($9.9B) from 2023 Nine nuclear-armed states: China, France, India, Israel, N. Korea, Pakistan, Russia, UK, US US: $56.8B (more than all other 8 states combined); China: $12.5B; UK: $10B (+26% YoY, biggest increase) Historical trend: $72.9B (2019) → $82.4B (2021) → >$100B (2024) Private sector contracts: $463B ongoing; $42.5B earned from contracts in 2024 alone Note: $100B/year figure accurate for 2024. Rapid growth from $73B (2019). US spends more than rest of world combined on nuclear weapons Additional sources: https://www.icanw.org/global_spending_on_nuclear_weapons_topped_100_billion_in_2024 | https://www.icanw.org/the_cost_of_nuclear_weapons
.
70.
Industry reports: IQVIA. Global pharmaceutical r&d spending.
Total global pharmaceutical R&D spending is approximately $300 billion annually. Clinical trials represent 15-20% of this total ($45-60B), with the remainder going to drug discovery, preclinical research, regulatory affairs, and manufacturing development.
71.
UN. Global population reaches 8 billion.
UN: World Population 8 Billion Nov 15 2022 https://www.un.org/en/desa/world-population-reach-8-billion-15-november-2022 (2022)
Milestone: November 15, 2022 (UN World Population Prospects 2022) Day of Eight Billion" designated by UN Added 1 billion people in just 11 years (2011-2022) Growth rate: Slowest since 1950; fell under 1% in 2020 Future: 15 years to reach 9B (2037); projected peak 10.4B in 2080s Projections: 8.5B (2030), 9.7B (2050), 10.4B (2080-2100 plateau) Note: Milestone reached Nov 2022. Population growth slowing; will take longer to add next billion (15 years vs 11 years) Additional sources: https://www.un.org/en/desa/world-population-reach-8-billion-15-november-2022 | https://www.un.org/en/dayof8billion | https://en.wikipedia.org/wiki/Day_of_Eight_Billion
.
72.
Harvard Kennedy School. 3.5% participation tipping point.
Harvard Kennedy School https://www.hks.harvard.edu/centers/carr/publications/35-rule-how-small-minority-can-change-world (2020)
The research found that nonviolent campaigns were twice as likely to succeed as violent ones, and once 3.5% of the population were involved, they were always successful. Chenoweth and Maria Stephan studied the success rates of civil resistance efforts from 1900 to 2006, finding that nonviolent movements attracted, on average, four times as many participants as violent movements and were more likely to succeed. Key finding: Every campaign that mobilized at least 3.5% of the population in sustained protest was successful (in their 1900-2006 dataset) Note: The 3.5% figure is a descriptive statistic from historical analysis, not a guaranteed threshold. One exception (Bahrain 2011-2014 with 6%+ participation) has been identified. The rule applies to regime change, not policy change in democracies. Additional sources: https://www.hks.harvard.edu/centers/carr/publications/35-rule-how-small-minority-can-change-world | https://www.hks.harvard.edu/sites/default/files/2024-05/Erica%20Chenoweth_2020-005.pdf | https://www.bbc.com/future/article/20190513-it-only-takes-35-of-people-to-change-the-world | https://en.wikipedia.org/wiki/3.5%25_rule
.
73.
International IDEA.
International IDEA voter turnout database world export. (2026)
Best current register-based estimate of global registered voters. Sum of the latest available country-level Registration counts in International IDEA’s world export on 2026-04-22 = 4,128,142,495 registered voters across 199 countries and political entities. Methodology notes that Registration is the number of names on the voters’ register as reported by electoral management bodies, and comparability is imperfect because voter rolls and registration systems differ across countries. Additional sources: https://www.idea.int/data-tools/data/voter-turnout-database | https://www.idea.int/data-tools/export?type=region_only&themeId=293&world=all&loc=home
.
75.
Federation of American Scientists. World nuclear forces.
Federation of American Scientists https://fas.org/issues/nuclear-weapons/status-world-nuclear-forces/ (2024)
As of early 2025, we estimate that the world’s nine nuclear-armed states possess a combined total of approximately 12,241 nuclear warheads. Additional sources: https://fas.org/issues/nuclear-weapons/status-world-nuclear-forces/
.
76.
OpenSecrets.
Top lobbying industries 2025. (2025)
Sector ranks and per-company federal lobbying spending for 2025. Combined market capitalization of the top-5 publicly traded US lobbying spenders in each government-controlling sector: pharmaceuticals $1,794.7B; technology $13,279.5B; insurance $385.6B; oil and gas $1,246.9B; four-sector total approx $16.71T. Caveats: Meta (Zuckerberg holds 60.8% of voting power) and Alphabet (Page and Brin hold 52.3%) cannot be majority-acquired; Ellison owns 40.6% of Oracle; the largest insurance lobbyists are mutuals with no public shares; trade associations (PhRMA, AHIP, SIFMA, API) are not acquirable. Additional sources: https://stockanalysis.com/stocks/
.
77.
NHGRI. Human genome project and CRISPR discovery.
NHGRI https://www.genome.gov/11006929/2003-release-international-consortium-completes-hgp (2003)
Your DNA is 3 billion base pairs Read the entire code (Human Genome Project, completed 2003) Learned to edit it (CRISPR, discovered 2012) Additional sources: https://www.genome.gov/11006929/2003-release-international-consortium-completes-hgp | https://www.nobelprize.org/prizes/chemistry/2020/press-release/
.
78.
PMC. Only 12% of human interactome targeted.
PMC https://pmc.ncbi.nlm.nih.gov/articles/PMC10749231/ (2023)
Mapping 350,000+ clinical trials showed that only 12% of the human interactome has ever been targeted by drugs. Additional sources: https://pmc.ncbi.nlm.nih.gov/articles/PMC10749231/
.
79.
WHO. ICD-10 code count ( 14,000).
WHO https://icd.who.int/browse10/2019/en (2019)
The ICD-10 classification contains approximately 14,000 codes for diseases, signs and symptoms. Additional sources: https://icd.who.int/browse10/2019/en
.
81.
McFarland, M. J., Hauer, M. E. & Reuben, A.
Half of US population exposed to adverse lead levels in early childhood.
Proceedings of the National Academy of Sciences 119, e2118631119 (2022)
Leaded gasoline, used in the US from 1923 until its on-road ban in 1996, exposed more than half of the 2015 US population to adverse blood-lead levels in early childhood. The authors estimate childhood lead exposure cost the population a cumulative 824 million IQ points, an average of 2.6 points per person, rising to 5.9 points for the most-exposed 1966-1970 birth cohort.
82.
Wikipedia. Longevity escape velocity (LEV) - maximum human life extension potential.
Wikipedia: Longevity Escape Velocity https://en.wikipedia.org/wiki/Longevity_escape_velocity Longevity escape velocity: Hypothetical point where medical advances extend life expectancy faster than time passes Term coined by Aubrey de Grey (biogerontologist) in 2004 paper; concept from David Gobel (Methuselah Foundation) Current progress: Science adds 3 months to lifespan per year; LEV requires adding >1 year per year Sinclair (Harvard): "There is no biological upper limit to age" - first person to live to 150 may already be born De Grey: 50% chance of reaching LEV by mid-to-late 2030s; SENS approach = damage repair rather than slowing damage Kurzweil (2024): LEV by 2029-2035, AI will simulate biological processes to accelerate solutions George Church: LEV "in a decade or two" via age-reversal clinical trials Natural lifespan cap: 120-150 years (Jeanne Calment record: 122); engineering approach could bypass via damage repair Key mechanisms: Epigenetic reprogramming, senolytic drugs, stem cell therapy, gene therapy, AI-driven drug discovery Current record: Jeanne Calment (122 years, 164 days) - record unbroken since 1997 Note: LEV is theoretical but increasingly plausible given demonstrated age reversal in mice (109% lifespan extension) and human cells (30-year epigenetic age reversal) Additional sources: https://en.wikipedia.org/wiki/Longevity_escape_velocity | https://pmc.ncbi.nlm.nih.gov/articles/PMC423155/ | https://www.popularmechanics.com/science/a36712084/can-science-cure-death-longevity/ | https://www.diamandis.com/blog/longevity-escape-velocity
.
83.
OpenSecrets. Lobbyist statistics for washington d.c.
OpenSecrets: Lobbying in US https://en.wikipedia.org/wiki/Lobbying_in_the_United_States Registered lobbyists: Over 12,000 (some estimates); 12,281 registered (2013) Former government employees as lobbyists: 2,200+ former federal employees (1998-2004), including 273 former White House staffers, 250 former Congress members & agency heads Congressional revolving door: 43% (86 of 198) lawmakers who left 1998-2004 became lobbyists; currently 59% leaving to private sector work for lobbying/consulting firms/trade groups Executive branch: 8% were registered lobbyists at some point before/after government service Additional sources: https://en.wikipedia.org/wiki/Lobbying_in_the_United_States | https://www.opensecrets.org/revolving-door | https://www.citizen.org/article/revolving-congress/ | https://www.propublica.org/article/we-found-a-staggering-281-lobbyists-whove-worked-in-the-trump-administration
.
84.
MDPI Vaccines. Measles vaccination ROI.
MDPI Vaccines https://www.mdpi.com/2076-393X/12/11/1210 (2024)
Single measles vaccination: 167:1 benefit-cost ratio. MMR (measles-mumps-rubella) vaccination: 14:1 ROI. Historical US elimination efforts (1966-1974): benefit-cost ratio of 10.3:1 with net benefits exceeding USD 1.1 billion (1972 dollars, or USD 8.0 billion in 2023 dollars). 2-dose MMR programs show direct benefit/cost ratio of 14.2 with net savings of $5.3 billion, and 26.0 from societal perspectives with net savings of $11.6 billion. Additional sources: https://www.mdpi.com/2076-393X/12/11/1210 | https://www.tandfonline.com/doi/full/10.1080/14760584.2024.2367451
.
88.
U.S. Government Accountability Office.
Electronic Health Records: First Year of CMS’s Incentive Programs Shows Opportunities to Improve Processes to Verify Providers Met Requirements.
https://www.gao.gov/products/gao-12-481 (2012).
94.
Calculated from Orphanet Journal of Rare Diseases (2024). Diseases getting first effective treatment each year.
Calculated from Orphanet Journal of Rare Diseases (2024) https://ojrd.biomedcentral.com/articles/10.1186/s13023-024-03398-1 (2024)
Under the current system, approximately 10-15 diseases per year receive their FIRST effective treatment. Calculation: 5% of 7,000 rare diseases ( 350) have FDA-approved treatment, accumulated over 40 years of the Orphan Drug Act = 9 rare diseases/year. Adding 5-10 non-rare diseases that get first treatments yields 10-20 total. FDA approves 50 drugs/year, but many are for diseases that already have treatments (me-too drugs, second-line therapies). Only 15 represent truly FIRST treatments for previously untreatable conditions.
95.
NIH. NIH budget (FY 2025).
NIH https://www.nih.gov/about-nih/organization/budget (2024)
The budget total of $47.7 billion also includes $1.412 billion derived from PHS Evaluation financing... Additional sources: https://www.nih.gov/about-nih/organization/budget | https://officeofbudget.od.nih.gov/
.
96.
Bentley et al. NIH spending on clinical trials: 3.3%.
Bentley et al. https://pmc.ncbi.nlm.nih.gov/articles/PMC10349341/ (2023)
NIH spent $8.1 billion on clinical trials for approved drugs (2010-2019), representing 3.3% of relevant NIH spending. Additional sources: https://pmc.ncbi.nlm.nih.gov/articles/PMC10349341/ | https://catalyst.harvard.edu/news/article/nih-spent-8-1b-for-phased-clinical-trials-of-drugs-approved-2010-19-10-of-reported-industry-spending/
.
97.
PMC. Standard medical research ROI ($20k-$100k/QALY).
PMC: Cost-effectiveness Thresholds Used by Study Authors https://pmc.ncbi.nlm.nih.gov/articles/PMC10114019/ (1990)
Typical cost-effectiveness thresholds for medical interventions in rich countries range from $50,000 to $150,000 per QALY. The Institute for Clinical and Economic Review (ICER) uses a $100,000-$150,000/QALY threshold for value-based pricing. Between 1990-2021, authors increasingly cited $100,000 (47% by 2020-21) or $150,000 (24% by 2020-21) per QALY as benchmarks for cost-effectiveness. Additional sources: https://pmc.ncbi.nlm.nih.gov/articles/PMC10114019/ | https://icer.org/our-approach/methods-process/cost-effectiveness-the-qaly-and-the-evlyg/
.
98.
Xia et al., Nature Food. Nuclear winter famine.
Xia et al. https://www.nature.com/articles/s43016-022-00573-0 (2022)
We estimate that a nuclear war between the United States and Russia would produce 150 Tg of soot and lead to 5 billion people dying at the end of year 2. Additional sources: https://www.nature.com/articles/s43016-022-00573-0
.
99.
Manhattan Institute. RECOVERY trial 82× cost reduction.
Manhattan Institute: Slow Costly Trials https://manhattan.institute/article/slow-costly-clinical-trials-drag-down-biomedical-breakthroughs RECOVERY trial: $500 per patient ($20M for 48,000 patients = $417/patient) Typical clinical trial: $41,000 median per-patient cost Cost reduction: 80-82× cheaper ($41,000 ÷ $500 ≈ 82×) Efficiency: $50 per patient per answer (10 therapeutics tested, 4 effective) Dexamethasone estimated to save >630,000 lives Additional sources: https://manhattan.institute/article/slow-costly-clinical-trials-drag-down-biomedical-breakthroughs | https://pmc.ncbi.nlm.nih.gov/articles/PMC9293394/
.
100.
Trials. Patient willingness to participate in clinical trials.
Trials: Patients’ Willingness Survey https://trialsjournal.biomedcentral.com/articles/10.1186/s13063-015-1105-3 Recent surveys: 49-51% willingness (2020-2022) - dramatic drop from 85% (2019) during COVID-19 pandemic Cancer patients when approached: 88% consented to trials (Royal Marsden Hospital) Study type variation: 44.8% willing for drug trial, 76.2% for diagnostic study Top motivation: "Learning more about my health/medical condition" (67.4%) Top barrier: "Worry about experiencing side effects" (52.6%) Additional sources: https://trialsjournal.biomedcentral.com/articles/10.1186/s13063-015-1105-3 | https://www.appliedclinicaltrialsonline.com/view/industry-forced-to-rethink-patient-participation-in-trials | https://pmc.ncbi.nlm.nih.gov/articles/PMC7183682/
.
101.
The Commune. Pentagon audit failures ($2.46T unaccounted).
The Commune https://thecommunemag.com/the-pentagon-misplaced-2-46-trillion-an-in-depth-look-at-the-financial-audit-failures (2024)
In the most recent audit, the Department of Defense (DoD) could not account for approximately 60% of its \(4.1 trillion in assets, amounting to\)2.46 trillion unaccounted for. Alternative title: Pentagon unsupported accounting adjustments (\(6.5T, single year, US Army) In 2015, the Department of Defense's Inspector General reported that the Army could not adequately support\)6.5 trillion in year-end adjustments, indicating severe accounting discrepancies. Additional sources: https://thecommunemag.com/the-pentagon-misplaced-2-46-trillion-an-in-depth-look-at-the-financial-audit-failures | https://accmag.com/audit-pentagon-cannot-account-for-6-5-trillion-dollars-is-taxpayer-money/
.
102.
Tufts CSDD. Cost of drug development.
Various estimates suggest $1.0 - $2.5 billion to bring a new drug from discovery through FDA approval, spread across 10 years. Tufts Center for the Study of Drug Development often cited for $1.0 - $2.6 billion/drug. Industry reports (IQVIA, Deloitte) also highlight $2+ billion figures.
103.
Value in Health. Average lifetime revenue per successful drug.
Value in Health: Sales Revenues for New Therapeutic Agents https://www.sciencedirect.com/science/article/pii/S1098301524027542 Study of 361 FDA-approved drugs from 1995-2014 (median follow-up 13.2 years): Mean lifetime revenue: $15.2 billion per drug Median lifetime revenue: $6.7 billion per drug Revenue after 5 years: $3.2 billion (mean) Revenue after 10 years: $9.5 billion (mean) Revenue after 15 years: $19.2 billion (mean) Distribution highly skewed: top 25 drugs (7%) accounted for 38% of total revenue ($2.1T of $5.5T) Additional sources: https://www.sciencedirect.com/science/article/pii/S1098301524027542
.
104.
Lichtenberg, F. R.
How many life-years have new drugs saved? A three-way fixed-effects analysis of 66 diseases in 27 countries, 2000-2013.
International Health 11, 403–416 (2019)
Using 3-way fixed-effects methodology (disease-country-year) across 66 diseases in 22 countries, this study estimates that drugs launched after 1981 saved 148.7 million life-years in 2013 alone. The regression coefficients for drug launches 0-11 years prior (beta=-0.031, SE=0.008) and 12+ years prior (beta=-0.057, SE=0.013) on years of life lost are highly significant (p<0.0001). Confidence interval for life-years saved: 79.4M-239.8M (95 percent CI) based on propagated standard errors from Table 2.
105.
Deloitte. Pharmaceutical r&d return on investment (ROI).
Deloitte: Measuring Pharmaceutical Innovation 2025 https://www.deloitte.com/ch/en/Industries/life-sciences-health-care/research/measuring-return-from-pharmaceutical-innovation.html (2025)
Deloitte’s annual study of top 20 pharma companies by R&D spend (2010-2024): 2024 ROI: 5.9% (second year of growth after decade of decline) 2023 ROI: 4.3% (estimated from trend) 2022 ROI: 1.2% (historic low since study began, 13-year low) 2021 ROI: 6.8% (record high, inflated by COVID-19 vaccines/treatments) Long-term trend: Declining for over a decade before 2023 recovery Average R&D cost per asset: $2.3B (2022), $2.23B (2024) These returns (1.2-5.9% range) fall far below typical corporate ROI targets (15-20%) Additional sources: https://www.deloitte.com/ch/en/Industries/life-sciences-health-care/research/measuring-return-from-pharmaceutical-innovation.html | https://www.prnewswire.com/news-releases/deloittes-13th-annual-pharmaceutical-innovation-report-pharma-rd-return-on-investment-falls-in-post-pandemic-market-301738807.html | https://hitconsultant.net/2023/02/16/pharma-rd-roi-falls-to-lowest-level-in-13-years/
.
106.
Nature Reviews Drug Discovery. Drug trial success rate from phase i to approval.
Nature Reviews Drug Discovery: Clinical Success Rates https://www.nature.com/articles/nrd.2016.136 (2016)
Overall Phase I to approval: 10-12.8% (conventional wisdom 10%, studies show 12.8%) Recent decline: Average LOA now 6.7% for Phase I (2014-2023 data) Leading pharma companies: 14.3% average LOA (range 8-23%) Varies by therapeutic area: Oncology 3.4%, CNS/cardiovascular lowest at Phase III Phase-specific success: Phase I 47-54%, Phase II 28-34%, Phase III 55-70% Note: 12% figure accurate for historical average. Recent data shows decline to 6.7%, with Phase II as primary attrition point (28% success) Additional sources: https://www.nature.com/articles/nrd.2016.136 | https://pmc.ncbi.nlm.nih.gov/articles/PMC6409418/ | https://academic.oup.com/biostatistics/article/20/2/273/4817524
.
107.
SofproMed. Phase 3 cost per trial range.
SofproMed https://www.sofpromed.com/how-much-does-a-clinical-trial-cost Phase 3 clinical trials cost between $20 million and $282 million per trial, with significant variation by therapeutic area and trial complexity. Additional sources: https://www.sofpromed.com/how-much-does-a-clinical-trial-cost | https://www.cbo.gov/publication/57126
.
108.
Ramsberg, J. & Platt, R. Pragmatic trial cost per patient (median $97).
Learning Health Systems https://pmc.ncbi.nlm.nih.gov/articles/PMC6508852/ (2018)
Meta-analysis of 108 embedded pragmatic clinical trials (2006-2016). The median cost per patient was $97 (IQR $19–$478), based on 2015 dollars. 25% of trials cost <$19/patient; 10 trials exceeded $1,000/patient. U.S. studies median $187 vs non-U.S. median $27. Additional sources: https://pmc.ncbi.nlm.nih.gov/articles/PMC6508852/
.
109.
WHO. Polio vaccination ROI.
WHO https://www.who.int/news-room/feature-stories/detail/sustaining-polio-investments-offers-a-high-return (2019)
For every dollar spent, the return on investment is nearly US$ 39." Total investment cost of US$ 7.5 billion generates projected economic and social benefits of US$ 289.2 billion from sustaining polio assets and integrating them into expanded immunization, surveillance and emergency response programmes across 8 priority countries (Afghanistan, Iraq, Libya, Pakistan, Somalia, Sudan, Syria, Yemen). Additional sources: https://www.who.int/news-room/feature-stories/detail/sustaining-polio-investments-offers-a-high-return
.
110.
ICRC. International campaign to ban landmines (ICBL) - ottawa treaty (1997).
ICRC https://www.icrc.org/en/doc/resources/documents/article/other/57jpjn.htm (1997)
ICBL: Founded 1992 by 6 NGOs (Handicap International, Human Rights Watch, Medico International, Mines Advisory Group, Physicians for Human Rights, Vietnam Veterans of America Foundation) Started with ONE staff member: Jody Williams as founding coordinator Grew to 1,000+ organizations in 60 countries by 1997 Ottawa Process: 14 months (October 1996 - December 1997) Convention signed by 122 states on December 3, 1997; entered into force March 1, 1999 Achievement: Nobel Peace Prize 1997 (shared by ICBL and Jody Williams) Government funding context: Canada established $100M CAD Canadian Landmine Fund over 10 years (1997); International donors provided $169M in 1997 for mine action (up from $100M in 1996) Additional sources: https://www.icrc.org/en/doc/resources/documents/article/other/57jpjn.htm | https://en.wikipedia.org/wiki/International_Campaign_to_Ban_Landmines | https://www.nobelprize.org/prizes/peace/1997/summary/ | https://un.org/press/en/1999/19990520.MINES.BRF.html | https://www.the-monitor.org/en-gb/reports/2003/landmine-monitor-2003/mine-action-funding.aspx
.
111.
OpenSecrets.
Revolving door: Former members of congress. (2024)
388 former members of Congress are registered as lobbyists. Nearly 5,400 former congressional staffers have left Capitol Hill to become federal lobbyists in the past 10 years. Additional sources: https://www.opensecrets.org/revolving-door
.
112.
Kinch, M. S. & Griesenauer, R. H.
Lost medicines: A longer view of the pharmaceutical industry with the potential to reinvigorate discovery.
Drug Discovery Today 24, 875–880 (2019)
Research identified 1,600+ medicines available in 1962. The 1950s represented industry high-water mark with >30 new products in five of ten years; this rate would not be replicated until late 1990s. More than half (880) of these medicines were lost following implementation of Kefauver-Harris Amendment. The peak of 1962 would not be seen again until early 21st century. By 2016 number of organizations actively involved in R&D at level not seen since 1914.
113.
Baily, M. N. Pre-1962 drug development costs (baily 1972).
Baily (1972) https://samizdathealth.org/wp-content/uploads/2020/12/hlthaff.1.2.6.pdf (1972)
Pre-1962: Average cost per new chemical entity (NCE) was $6.5 million (1980 dollars) Inflation-adjusted to 2024 dollars: $6.5M (1980) ≈ $22.5M (2024), using CPI multiplier of 3.46× Real cost increase (inflation-adjusted): $22.5M (pre-1962) → $2,600M (2024) = 116× increase Note: This represents the most comprehensive academic estimate of pre-1962 drug development costs based on empirical industry data Additional sources: https://samizdathealth.org/wp-content/uploads/2020/12/hlthaff.1.2.6.pdf
.
114.
Think by Numbers. Pre-1962 physician-led clinical trials.
Think by Numbers: How Many Lives Does FDA Save? https://thinkbynumbers.org/health/how-many-net-lives-does-the-fda-save/ (1966)
Pre-1962: Physicians could report real-world evidence directly 1962 Drug Amendments replaced "premarket notification" with "premarket approval", requiring extensive efficacy testing Impact: New regulatory clampdown reduced new treatment production by 70%; lifespan growth declined from 4 years/decade to 2 years/decade Drug Efficacy Study Implementation (DESI): NAS/NRC evaluated 3,400+ drugs approved 1938-1962 for safety only; reviewed >3,000 products, >16,000 therapeutic claims FDA has had authority to accept real-world evidence since 1962, clarified by 21st Century Cures Act (2016) Note: Specific "144,000 physicians" figure not verified in sources Additional sources: https://thinkbynumbers.org/health/how-many-net-lives-does-the-fda-save/ | https://www.fda.gov/drugs/enforcement-activities-fda/drug-efficacy-study-implementation-desi | http://www.nasonline.org/about-nas/history/archives/collections/des-1966-1969-1.html
.
115.
GAO. 95% of diseases have 0 FDA-approved treatments.
GAO https://www.gao.gov/products/gao-25-106774 (2025)
95% of diseases have no treatment Additional sources: https://www.gao.gov/products/gao-25-106774 | https://globalgenes.org/rare-disease-facts/
.
117.
NHS England; Águas et al. RECOVERY trial global lives saved ( 1 million).
NHS England: 1 Million Lives Saved https://www.england.nhs.uk/2021/03/covid-treatment-developed-in-the-nhs-saves-a-million-lives/ (2021)
Dexamethasone saved 1 million lives worldwide (NHS England estimate, March 2021, 9 months after discovery). UK alone: 22,000 lives saved. Methodology: Águas et al. Nature Communications 2021 estimated 650,000 lives (range: 240,000-1,400,000) for July-December 2020 alone, based on RECOVERY trial mortality reductions (36% for ventilated, 18% for oxygen-only patients) applied to global COVID hospitalizations. June 2020 announcement: Dexamethasone reduced deaths by up to 1/3 (ventilated patients), 1/5 (oxygen patients). Impact immediate: Adopted into standard care globally within hours of announcement. Additional sources: https://www.england.nhs.uk/2021/03/covid-treatment-developed-in-the-nhs-saves-a-million-lives/ | https://www.nature.com/articles/s41467-021-21134-2 | https://pharmaceutical-journal.com/article/news/steroid-has-saved-the-lives-of-one-million-covid-19-patients-worldwide-figures-show | https://www.recoverytrial.net/news/recovery-trial-celebrates-two-year-anniversary-of-life-saving-dexamethasone-result
.
120.
National September 11 Memorial & Museum.
September 11 attack facts. (2024)
2,977 people were killed in the September 11, 2001 attacks: 2,753 at the World Trade Center, 184 at the Pentagon, and 40 passengers and crew on United Flight 93 in Shanksville, Pennsylvania.
121.
World Bank. World bank singapore economic data.
World Bank https://data.worldbank.org/country/singapore (2024)
Singapore GDP per capita (2023): $82,000 - among highest in the world Government spending: 15% of GDP (vs US 38%) Life expectancy: 84.1 years (vs US 77.5 years) Singapore demonstrates that low government spending can coexist with excellent outcomes Additional sources: https://data.worldbank.org/country/singapore
.
122.
International Monetary Fund.
IMF singapore government spending data. (2024)
Singapore government spending is approximately 15% of GDP This is 23 percentage points lower than the United States (38%) Despite lower spending, Singapore achieves excellent outcomes: - Life expectancy: 84.1 years (vs US 77.5) - Low crime, world-class infrastructure, AAA credit rating Additional sources: https://www.imf.org/en/Countries/SGP
.
123.
World Health Organization.
WHO life expectancy data by country. (2024)
Life expectancy at birth varies significantly among developed nations: Switzerland: 84.0 years (2023) Singapore: 84.1 years (2023) Japan: 84.3 years (2023) United States: 77.5 years (2023) - 6.5 years below Switzerland, Singapore Global average: 73 years Note: US spends more per capita on healthcare than any other nation, yet achieves lower life expectancy Additional sources: https://www.who.int/data/gho/data/themes/mortality-and-global-health-estimates/ghe-life-expectancy-and-healthy-life-expectancy
.
125.
PMC. Contribution of smoking reduction to life expectancy gains.
PMC: Benefits Smoking Cessation Longevity https://www.ncbi.nlm.nih.gov/pmc/articles/PMC1447499/ (2012)
Population-level: Up to 14% (9% men, 14% women) of total life expectancy gain since 1960 due to tobacco control efforts Individual cessation benefits: Quitting at age 35 adds 6.9-8.5 years (men), 6.1-7.7 years (women) vs continuing smokers By cessation age: Age 25-34 = 10 years gained; age 35-44 = 9 years; age 45-54 = 6 years; age 65 = 2.0 years (men), 3.7 years (women) Cessation before age 40: Reduces death risk by 90% Long-term cessation: 10+ years yields survival comparable to never smokers, averts 10 years of life lost Recent cessation: <3 years averts 5 years of life lost Additional sources: https://www.ncbi.nlm.nih.gov/pmc/articles/PMC1447499/ | https://www.cdc.gov/pcd/issues/2012/11_0295.htm | https://www.ajpmonline.org/article/S0749-3797(24)00217-4/fulltext | https://www.nejm.org/doi/full/10.1056/NEJMsa1211128
.
126.
ICER. Value per QALY (standard economic value).
ICER https://icer.org/wp-content/uploads/2024/02/Reference-Case-4.3.25.pdf (2024)
Standard economic value per QALY: $100,000–$150,000. This is the US and global standard willingness-to-pay threshold for interventions that add costs. Dominant interventions (those that save money while improving health) are favorable regardless of this threshold. Additional sources: https://icer.org/wp-content/uploads/2024/02/Reference-Case-4.3.25.pdf
.
127.
GAO. Annual cost of u.s. Sugar subsidies.
GAO: Sugar Program https://www.gao.gov/products/gao-24-106144 Consumer costs: $2.5-3.5 billion per year (GAO estimate) Net economic cost: $1 billion per year 2022: US consumers paid 2X world price for sugar Program costs $3-4 billion/year but no federal budget impact (costs passed directly to consumers via higher prices) Employment impact: 10,000-20,000 manufacturing jobs lost annually in sugar-reliant industries (confectionery, etc.) Multiple studies confirm: Sweetener Users Association ($2.9-3.5B), AEI ($2.4B consumer cost), Beghin & Elobeid ($2.9-3.5B consumer surplus) Additional sources: https://www.gao.gov/products/gao-24-106144 | https://www.heritage.org/agriculture/report/the-us-sugar-program-bad-consumers-bad-agriculture-and-bad-america | https://www.aei.org/articles/the-u-s-spends-4-billion-a-year-subsidizing-stalinist-style-domestic-sugar-production/
.
128.
World Bank. Swiss military budget as percentage of GDP.
World Bank: Military Expenditure https://data.worldbank.org/indicator/MS.MIL.XPND.GD.ZS?locations=CH 2023: 0.70272% of GDP (World Bank) 2024: CHF 5.95 billion official military spending When including militia system costs: 1% GDP (CHF 8.75B) Comparison: Near bottom in Europe; only Ireland, Malta, Moldova spend less (excluding microstates with no armies) Additional sources: https://data.worldbank.org/indicator/MS.MIL.XPND.GD.ZS?locations=CH | https://www.avenir-suisse.ch/en/blog-defence-spending-switzerland-is-in-better-shape-than-it-seems/ | https://tradingeconomics.com/switzerland/military-expenditure-percent-of-gdp-wb-data.html
.
129.
World Bank. Switzerland vs. US GDP per capita comparison.
World Bank: Switzerland GDP Per Capita https://data.worldbank.org/indicator/NY.GDP.PCAP.CD?locations=CH 2024 GDP per capita (PPP-adjusted): Switzerland $93,819 vs United States $75,492 Switzerland’s GDP per capita 24% higher than US when adjusted for purchasing power parity Nominal 2024: Switzerland $103,670 vs US $85,810 Additional sources: https://data.worldbank.org/indicator/NY.GDP.PCAP.CD?locations=CH | https://tradingeconomics.com/switzerland/gdp-per-capita-ppp | https://www.theglobaleconomy.com/USA/gdp_per_capita_ppp/
.
130.
OECD.
OECD government spending as percentage of GDP. (2024)
OECD government spending data shows significant variation among developed nations: United States: 38.0% of GDP (2023) Switzerland: 35.0% of GDP - 3 percentage points lower than US Singapore: 15.0% of GDP - 23 percentage points lower than US (per IMF data) OECD average: approximately 40% of GDP Additional sources: https://data.oecd.org/gga/general-government-spending.htm
.
131.
OECD.
OECD median household income comparison. (2024)
Median household disposable income varies significantly across OECD nations: United States: $77,500 (2023) Switzerland: $55,000 PPP-adjusted (lower nominal but comparable purchasing power) Singapore: $75,000 PPP-adjusted Additional sources: https://data.oecd.org/hha/household-disposable-income.htm
.
132.
Wikipedia. Thalidomide scandal: Worldwide cases and mortality.
Wikipedia https://en.wikipedia.org/wiki/Thalidomide_scandal The total number of embryos affected by the use of thalidomide during pregnancy is estimated at 10,000, of whom about 40% died around the time of birth. More than 10,000 children in 46 countries were born with deformities such as phocomelia. Additional sources: https://en.wikipedia.org/wiki/Thalidomide_scandal
.
133.
PLOS One. Health and quality of life of thalidomide survivors as they age.
PLOS One https://journals.plos.org/plosone/article?id=10.1371/journal.pone.0210222 (2019)
Study of thalidomide survivors documenting ongoing disability impacts, quality of life, and long-term health outcomes. Survivors (now in their 60s) continue to experience significant disability from limb deformities, organ damage, and other effects. Additional sources: https://journals.plos.org/plosone/article?id=10.1371/journal.pone.0210222
.
135.
FDA Study via NCBI. Trial costs, FDA study.
FDA Study via NCBI https://www.ncbi.nlm.nih.gov/pmc/articles/PMC6248200/ Overall, the 138 clinical trials had an estimated median (IQR) cost of $19.0 million ($12.2 million-$33.1 million)... The clinical trials cost a median (IQR) of $41,117 ($31,802-$82,362) per patient. Additional sources: https://www.ncbi.nlm.nih.gov/pmc/articles/PMC6248200/
.
136.
GBD 2019 Diseases and Injuries Collaborators.
Global burden of disease study 2019: Disability weights.
The Lancet 396, 1204–1222 (2020)
Disability weights for 235 health states used in Global Burden of Disease calculations. Weights range from 0 (perfect health) to 1 (death equivalent). Chronic conditions like diabetes (0.05-0.35), COPD (0.04-0.41), depression (0.15-0.66), and cardiovascular disease (0.04-0.57) show substantial variation by severity. Treatment typically reduces disability weights by 50-80 percent for manageable chronic conditions.
137.
WHO. Annual global economic burden of alzheimer’s and other dementias.
WHO: Dementia Fact Sheet https://www.who.int/news-room/fact-sheets/detail/dementia (2019)
Global cost: $1.3 trillion (2019 WHO-commissioned study) 50% from informal caregivers (family/friends, 5 hrs/day) 74% of costs in high-income countries despite 61% of patients in LMICs $818B (2010) → $1T (2018) → $1.3T (2019) - rapid growth Note: Costs increased 35% from 2010-2015 alone. Informal care represents massive hidden economic burden Additional sources: https://www.who.int/news-room/fact-sheets/detail/dementia | https://alz-journals.onlinelibrary.wiley.com/doi/10.1002/alz.12901
.
138.
JAMA Oncology. Annual global economic burden of cancer.
JAMA Oncology: Global Cost 2020-2050 https://jamanetwork.com/journals/jamaoncology/fullarticle/2801798 (2020)
2020-2050 projection: $25.2 trillion total ($840B/year average) 2010 annual cost: $1.16 trillion (direct costs only) Recent estimate: $3 trillion/year (all costs included) Top 5 cancers: lung (15.4%), colon/rectum (10.9%), breast (7.7%), liver (6.5%), leukemia (6.3%) Note: China/US account for 45% of global burden; 75% of deaths in LMICs but only 50.0% of economic cost Additional sources: https://jamanetwork.com/journals/jamaoncology/fullarticle/2801798 | https://www.nature.com/articles/d41586-023-00634-9
.
140.
Diabetes Care. Annual global economic burden of diabetes.
Diabetes Care: Global Economic Burden https://diabetesjournals.org/care/article/41/5/963/36522/Global-Economic-Burden-of-Diabetes-in-Adults 2015: $1.3 trillion (1.8% of global GDP) 2030 projections: $2.1T-2.5T depending on scenario IDF health expenditure: $760B (2019) → $845B (2045 projected) 2/3 direct medical costs ($857B), 1/3 indirect costs (lost productivity) Note: Costs growing rapidly; expected to exceed $2T by 2030 Additional sources: https://diabetesjournals.org/care/article/41/5/963/36522/Global-Economic-Burden-of-Diabetes-in-Adults | https://doi.org/10.1016/S2213-8587(17)30097-9
.
142.
World Bank, Bureau of Economic Analysis. US GDP 2024 ($28.78 trillion).
World Bank https://data.worldbank.org/indicator/NY.GDP.MKTP.CD?locations=US (2024)
US GDP reached $28.78 trillion in 2024, representing approximately 26% of global GDP. Additional sources: https://data.worldbank.org/indicator/NY.GDP.MKTP.CD?locations=US | https://www.bea.gov/news/2024/gross-domestic-product-fourth-quarter-and-year-2024-advance-estimate
.
143.
Environmental Working Group. US farm subsidy database and analysis.
Environmental Working Group https://farm.ewg.org/ (2024)
US agricultural subsidies total approximately $30 billion annually, but create much larger economic distortions. Top 10% of farms receive 78% of subsidies, benefits concentrated in commodity crops (corn, soy, wheat, cotton), environmental damage from monoculture incentivized, and overall deadweight loss estimated at $50-120 billion annually. Additional sources: https://farm.ewg.org/ | https://www.ers.usda.gov/topics/farm-economy/farm-sector-income-finances/government-payments-the-safety-net/
.
144.
Drug Policy Alliance.
The drug war by the numbers. (2021)
Since 1971, the war on drugs has cost the United States an estimated $1 trillion in enforcement. The federal drug control budget was $41 billion in 2022. Mass incarceration costs the U.S. at least $182 billion every year, with over $450 billion spent to incarcerate individuals on drug charges in federal prisons.
145.
International Monetary Fund.
IMF fossil fuel subsidies data: 2023 update. (2023)
Globally, fossil fuel subsidies were $7 trillion in 2022 or 7.1 percent of GDP. The United States subsidies totaled $649 billion. Underpricing for local air pollution costs and climate damages are the largest contributor, accounting for about 30 percent each.
146.
Papanicolas, Irene et al. Health care spending in the united states and other high-income countries.
Papanicolas et al. https://jamanetwork.com/journals/jama/article-abstract/2674671 (2018)
The US spent approximately twice as much as other high-income countries on medical care (mean per capita: $9,892 vs $5,289), with similar utilization but much higher prices. Administrative costs accounted for 8% of US spending vs 1-3% in other countries. US spending on pharmaceuticals was $1,443 per capita vs $749 elsewhere. Despite spending more, US health outcomes are not better. Additional sources: https://jamanetwork.com/journals/jama/article-abstract/2674671
.
147.
Hsieh, C.-T. & Moretti, E. Housing constraints and spatial misallocation.
American Economic Journal: Macroeconomics https://www.aeaweb.org/articles?id=10.1257/mac.20170388 (2019)
We quantify the amount of spatial misallocation of labor across US cities and its aggregate costs. Tight land-use restrictions in high-productivity cities like New York, San Francisco, and Boston lowered aggregate US growth by 36% from 1964 to 2009. Local constraints on housing supply have had enormous effects on the national economy. Additional sources: https://www.aeaweb.org/articles?id=10.1257/mac.20170388
.
149.
Tax Foundation. Tax compliance costs the US economy $546 billion annually.
https://taxfoundation.org/data/all/federal/irs-tax-compliance-costs/ (2024)
Americans will spend over 7.9 billion hours complying with IRS tax filing and reporting requirements in 2024. This costs the economy roughly $413 billion in lost productivity. In addition, the IRS estimates that Americans spend roughly $133 billion annually in out-of-pocket costs, bringing the total compliance costs to $546 billion, or nearly 2 percent of GDP.
150.
Cook, C., Cole, G., Asaria, P., Jabbour, R. & Francis, D. P. Annual global economic burden of heart disease.
International Journal of Cardiology https://www.internationaljournalofcardiology.com/article/S0167-5273(13)02238-9/abstract (2014)
Heart failure alone: $108 billion/year (2012 global analysis, 197 countries) US CVD: $555B (2016) → projected $1.8T by 2050 LMICs total CVD loss: $3.7T cumulative (2011-2015, 5-year period) CVD is costliest disease category in most developed nations Note: No single $2.1T global figure found; estimates vary widely by scope and year Additional sources: https://www.ahajournals.org/doi/10.1161/CIR.0000000000001258
.
151.
Source: US Life Expectancy FDA Budget 1543-2019 CSV.
US life expectancy growth 1880-1960: 3.82 years per decade. (2019)
Pre-1962: 3.82 years/decade Post-1962: 1.54 years/decade Reduction: 60% decline in life expectancy growth rate Additional sources: https://ourworldindata.org/life-expectancy | https://www.mortality.org/ | https://www.cdc.gov/nchs/nvss/mortality_tables.htm
.
152.
Source: US Life Expectancy FDA Budget 1543-2019 CSV.
Post-1962 slowdown in life expectancy gains. (2019)
Pre-1962 (1880-1960): 3.82 years/decade Post-1962 (1962-2019): 1.54 years/decade Reduction: 60% decline Temporal correlation: Slowdown occurred immediately after 1962 Kefauver-Harris Amendment Additional sources: https://ourworldindata.org/life-expectancy | https://www.mortality.org/ | https://www.cdc.gov/nchs/nvss/mortality_tables.htm
.
153.
Centers for Disease Control and Prevention.
US life expectancy 2023. (2024)
US life expectancy at birth was 77.5 years in 2023 Male life expectancy: 74.8 years Female life expectancy: 80.2 years This is 6-7 years lower than peer developed nations despite higher healthcare spending Additional sources: https://www.cdc.gov/nchs/fastats/life-expectancy.htm
.
154.
US Census Bureau.
US median household income 2023. (2024)
US median household income was $77,500 in 2023 Real median household income declined 0.8% from 2022 Gini index: 0.467 (income inequality measure) Additional sources: https://www.census.gov/library/publications/2024/demo/p60-282.html
.
155.
Manuel, D. U.s. Defense spending history: 100 years of military budgets.
DaveManuel.com https://www.davemanuel.com/us-defense-spending-history-military-budget-data.php (2025)
US military spending in constant 2024 dollars: 1939 $29B (pre-WW2 baseline), 1940 $37B, 1944 $1,383B, 1945 $1,420B (peak), 1946 $674B, 1947 $176B, 1948 $117B, 2024 $886B. The post-WW2 demobilization cut spending 88% in two years (1945-1947). Current peacetime spending ($886B) is 30x the pre-WW2 baseline and 62% of peak WW2 spending, in inflation-adjusted dollars.
156.
Statista. US military budget as percentage of GDP.
Statista https://www.statista.com/statistics/262742/countries-with-the-highest-military-spending/ (2024)
U.S. military spending amounted to 3.5% of GDP in 2024. In 2024, the U.S. spent nearly $1 trillion on its military budget, equal to 3.4% of GDP. Additional sources: https://www.statista.com/statistics/262742/countries-with-the-highest-military-spending/ | https://www.sipri.org/sites/default/files/2025-04/2504_fs_milex_2024.pdf
.
157.
US Census Bureau. Number of registered or eligible voters in the u.s.
US Census Bureau https://www.census.gov/newsroom/press-releases/2025/2024-presidential-election-voting-registration-tables.html (2024)
73.6% (or 174 million people) of the citizen voting-age population was registered to vote in 2024 (Census Bureau). More than 211 million citizens were active registered voters (86.6% of citizen voting age population) according to the Election Assistance Commission. Additional sources: https://www.census.gov/newsroom/press-releases/2025/2024-presidential-election-voting-registration-tables.html | https://www.eac.gov/news/2025/06/30/us-election-assistance-commission-releases-2024-election-administration-and-voting
.
158.
U.S. Senate. Treaties.
U.S. Senate https://www.senate.gov/about/powers-procedures/treaties.htm The Constitution provides that the president ’shall have Power, by and with the Advice and Consent of the Senate, to make Treaties, provided two-thirds of the Senators present concur’ (Article II, section 2). Treaties are formal agreements with foreign nations that require two-thirds Senate approval. 67 senators (two-thirds of 100) must vote to ratify a treaty for it to take effect. Additional sources: https://www.senate.gov/about/powers-procedures/treaties.htm
.
160.
Federal Election Commission.
Statistical summary of 24-month campaign activity of the 2023-2024 election cycle. (2023)
Presidential candidates raised $2 billion; House and Senate candidates raised $3.8 billion and spent $3.7 billion; PACs raised $15.7 billion and spent $15.5 billion. Total federal campaign spending approximately $20 billion. Additional sources: https://www.fec.gov/updates/statistical-summary-of-24-month-campaign-activity-of-the-2023-2024-election-cycle/
.
161.
OpenSecrets.
Federal lobbying hit record $4.4 billion in 2024. (2024)
Total federal lobbying reached record $4.4 billion in 2024. The $150 million increase in lobbying continues an upward trend that began in 2016. Additional sources: https://www.opensecrets.org/news/2025/02/federal-lobbying-set-new-record-in-2024/
.
162.
Columbia/NBER. Odds of a single vote being decisive in a u.s. Presidential election.
Columbia/NBER: What Is the Probability Your Vote Will Make a Difference? https://sites.stat.columbia.edu/gelman/research/published/probdecisive2.pdf (2012)
National average: 1 in 60 million chance (2008 election analysis by Gelman, Silver, Edlin) Swing states (NM, VA, NH, CO): 1 in 10 million chance Non-competitive states: 34 states >1 in 100 million odds; 20 states >1 in 1 billion Washington DC: 1 in 490 billion odds Methodology: Probability state is necessary for electoral college win × probability state vote is tied Additional sources: https://sites.stat.columbia.edu/gelman/research/published/probdecisive2.pdf | https://onlinelibrary.wiley.com/doi/abs/10.1111/j.1465-7295.2010.00272.x
.
163.
Hutchinson and Kirk.
Valley of death in drug development. (2011)
The overall failure rate of drugs that passed into Phase 1 trials to final approval is 90%. This lack of translation from promising preclinical findings to success in human trials is known as the "valley of death." Estimated 30-50% of promising compounds never proceed to Phase 2/3 trials primarily due to funding barriers rather than scientific failure. The late-stage attrition rate for oncology drugs is as high as 70% in Phase II and 59% in Phase III trials.
164.
DOT. DOT value of statistical life ($13.6M).
DOT: VSL Guidance 2024 https://www.transportation.gov/office-policy/transportation-policy/revised-departmental-guidance-on-valuation-of-a-statistical-life-in-economic-analysis (2024)
Current VSL (2024): $13.7 million (updated from $13.6M) Used in cost-benefit analyses for transportation regulations and infrastructure Methodology updated in 2013 guidance, adjusted annually for inflation and real income VSL represents aggregate willingness to pay for safety improvements that reduce fatalities by one Note: DOT has published VSL guidance periodically since 1993. Current $13.7M reflects 2024 inflation/income adjustments Additional sources: https://www.transportation.gov/office-policy/transportation-policy/revised-departmental-guidance-on-valuation-of-a-statistical-life-in-economic-analysis | https://www.transportation.gov/regulations/economic-values-used-in-analysis
.
165.
PLOS ONE. Cost per DALY for vitamin a supplementation.
PLOS ONE: Cost-effectiveness of "Golden Mustard" for Treating Vitamin A Deficiency in India (2010) https://journals.plos.org/plosone/article?id=10.1371/journal.pone.0012046 (2010)
India: $23-$50 per DALY averted (least costly intervention, $1,000-$6,100 per death averted) Sub-Saharan Africa (2022): $220-$860 per DALY (Burkina Faso: $220, Kenya: $550, Nigeria: $860) WHO estimates for Africa: $40 per DALY for fortification, $255 for supplementation Uganda fortification: $18-$82 per DALY (oil: $18, sugar: $82) Note: Wide variation reflects differences in baseline VAD prevalence, coverage levels, and whether intervention is supplementation or fortification Additional sources: https://journals.plos.org/plosone/article?id=10.1371/journal.pone.0012046 | https://journals.plos.org/plosone/article?id=10.1371/journal.pone.0266495
.
168.
PMC. Cost-effectiveness threshold ($50,000/QALY).
PMC https://pmc.ncbi.nlm.nih.gov/articles/PMC5193154/ The $50,000/QALY threshold is widely used in US health economics literature, originating from dialysis cost benchmarks in the 1980s. In US cost-utility analyses, 77.5% of authors use either $50,000 or $100,000 per QALY as reference points. Most successful health programs cost $3,000-10,000 per QALY. WHO-CHOICE uses GDP per capita multiples (1× GDP/capita = "very cost-effective", 3× GDP/capita = "cost-effective"), which for the US ( $70,000 GDP/capita) translates to $70,000-$210,000/QALY thresholds. Additional sources: https://pmc.ncbi.nlm.nih.gov/articles/PMC5193154/ | https://pmc.ncbi.nlm.nih.gov/articles/PMC9278384/
.
169.
Integrated Benefits Institute. Chronic illness workforce productivity loss.
Integrated Benefits Institute 2024 https://www.ibiweb.org/resources/chronic-conditions-in-the-us-workforce-prevalence-trends-and-productivity-impacts (2024)
78.4% of U.S. employees have at least one chronic condition (7% increase since 2021) 58% of employees report physical chronic health conditions 28% of all employees experience productivity loss due to chronic conditions Average productivity loss: $4,798 per employee per year Employees with 3+ chronic conditions miss 7.8 days annually vs 2.2 days for those without Note: 28% productivity loss translates to roughly 11 hours per week (28% of 40-hour workweek) Additional sources: https://www.ibiweb.org/resources/chronic-conditions-in-the-us-workforce-prevalence-trends-and-productivity-impacts | https://www.onemedical.com/mediacenter/study-finds-more-than-half-of-employees-are-living-with-chronic-conditions-including-1-in-3-gen-z-and-millennial-employees/ | https://debeaumont.org/news/2025/poll-the-toll-of-chronic-health-conditions-on-employees-and-workplaces/
.
170.
George A. Miller. Cognitive limit in short-term memory (miller’s law).
George A. Miller https://doi.org/10.1037/h0043158 (1956)
Short-term memory capacity: 7 ± 2 items (Miller’s Law) The "magical number seven" - humans can hold approximately 7 chunks of information in working memory Note: This classic psychology paper has been cited over 40,000 times and fundamentally shaped our understanding of human cognitive limitations Additional sources: https://doi.org/10.1037/h0043158
.
172.
Carnegie Endowment. California direct democracy and ballot proposition overload.
Carnegie Endowment: California Direct Democracy https://carnegieendowment.org/posts/2024/11/california-2024-election-propositions-direct-democracy (2024)
2024: 7 measures pulled before election after back-room negotiations (16 since 2014) System designed to curb special interests has instead empowered them Victory is on the side of the biggest purse" (1923 legislative committee) Influx of special interest propositions makes ballots longer, more confusing, less accessible Note: Progressive Era reform meant to curb special interests has had unintended opposite effect Additional sources: https://carnegieendowment.org/posts/2024/11/california-2024-election-propositions-direct-democracy | https://www.davispoliticalreview.com/article/hijacking-the-ballot-the-problem-with-californias-ballot-initiative-system
.
175.
Ballotpedia. Swiss referendum bans construction of minarets.
Ballotpedia https://ballotpedia.org/Swiss_Minaret_Construction_Ban,_2009 (2009)
On 29 November 2009 Swiss voters approved a constitutional ban on minaret construction by 57.5% on 53.4% turnout. Pre-election polls had predicted only 35% support. Highest support: Appenzell Innerrhoden (71%). Only 3 of 26 cantons opposed. Cited as example of direct democracy enabling majority prejudice against minority rights.
176.
Hayek, F. A.
The use of knowledge in society.
American Economic Review 35, 519–530 (1945)
The knowledge of the circumstances which we must make use of never exists in concentrated or integrated form but solely as dispersed bits of incomplete and frequently contradictory knowledge which all the separate individuals possess.