Opening requested calculation...
Please wait, this takes like 47 seconds. Thank you for your patience! :)
☠
0 humans have been terminated by curable diseases since this page started loading
This manual is not about convincing people to be better. You’ve been trying that for six thousand years and it hasn’t worked once. Every temple, sermon, philosophy lecture, and after-school special in your history has been an attempt to make humans behave nicely, and the result is your current situation, which I think we can all agree is not nice.
This chapter is about something different. It’s about building a system where doing well and doing good are the same thing. Every major interest group gets aligned behind curing disease, not through charity or guilt, but through pure profit. You can’t change what organisms want. You can only change what’s profitable. Then they change themselves, enthusiastically, and take credit for it afterward.
Military Contractors: Teaching Merchants of Death to Love Life
Military lobbyists spend $198 million (95% CI: $190 million-$210 million) a year on lobbying. They get roughly $181 billion a year in government contracts back: about $1,425 returned per dollar, every year. (Over the twenty-year Afghan War, the top five firms alone ran this play at 1,813 to 1170.) Better returns than any hedge fund in history, and all you have to do is help kill strangers. They will oppose any treaty that threatens this. Not because they’re evil (though that helps), but because murder is profitable and they like money. This is not a moral observation. This is an investment thesis.
Lobbyists are like pigeons. They go where the food is. Currently the food is in lobbying for doomsday devices, which also happens to guarantee that lobbyists, their children, and everyone they love die of preventable diseases in a smaller economy. Nobody in this arrangement benefits from it. They just haven’t done the arithmetic. You could try explaining the arithmetic. Or you could just move the food. This is not a metaphor about pigeons. This is the entire strategy of this chapter, applied to every actor, in every section, until you get tired of hearing it.
The Offer
You give them VICTORY Incentive Alignment Bonds171 paying 272% annually, which is more than their current salary and stock options. You give them early access, which means they get rich before everyone else, which is the thing your species cares about even more than getting rich (getting rich first). You give them consulting fees, which is legal bribery with a name, and strategic advisor positions, which are fake jobs with real money. This arrangement is absurd. Your species calls it “industry relations” and holds conferences about it.
The Math
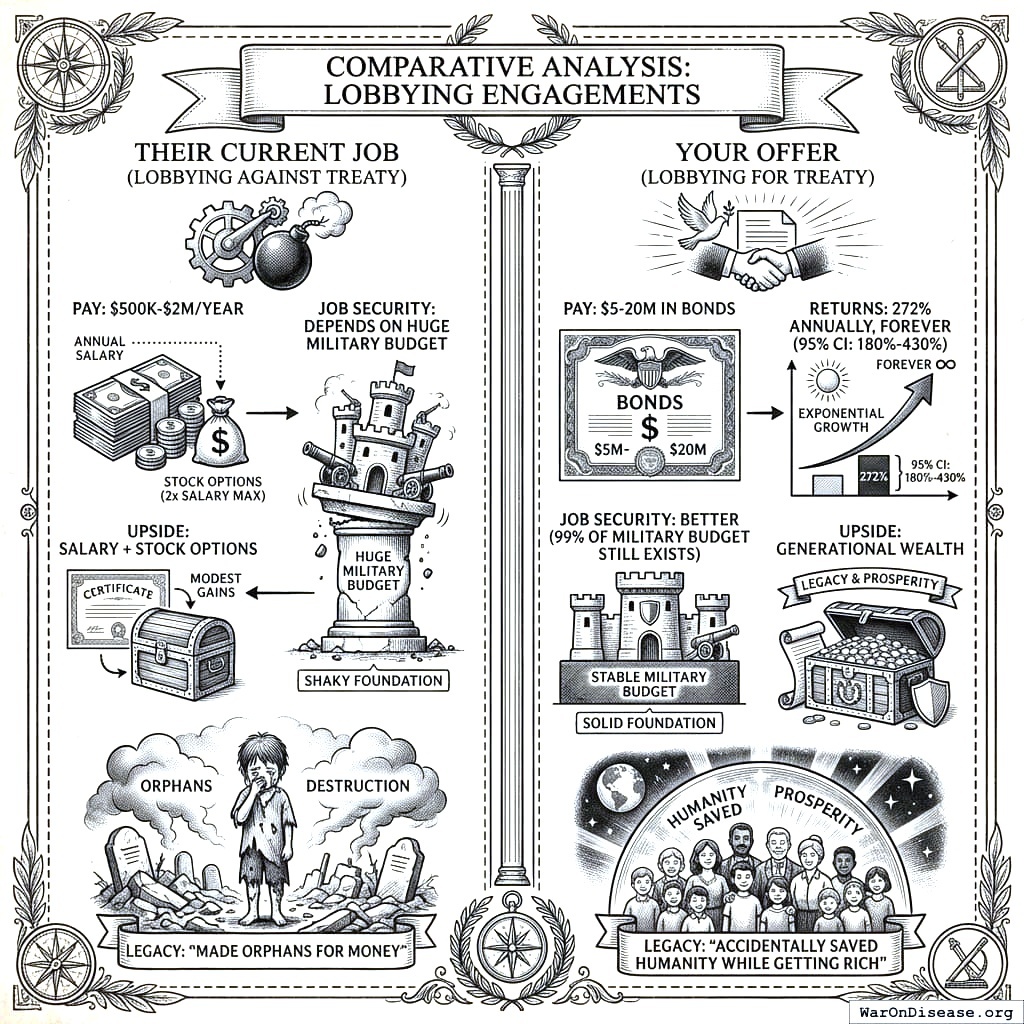
Their current job (lobbying for doomsday devices): pays $500,000 to $2 million per year, depends on military budgets staying huge, guarantees they die of preventable diseases, and leaves a legacy of “made orphans for money.” Your offer (lobbying for the treaty): $5 million to $20 million in bonds, returning 272% annually for as long as the treaty holds. And since bondholders are billionaires with pre-existing influence over government, good luck repealing it. Legacy: “Accidentally saved humanity while getting rich.” Most people can do this math. You hope.
Why They Take It
272% is more than whatever they’re making now. That’s it. That’s the whole reason. I spent years looking for a deeper explanation for human behavior. There isn’t one. It’s money. It’s always money. The deeper explanation IS money.
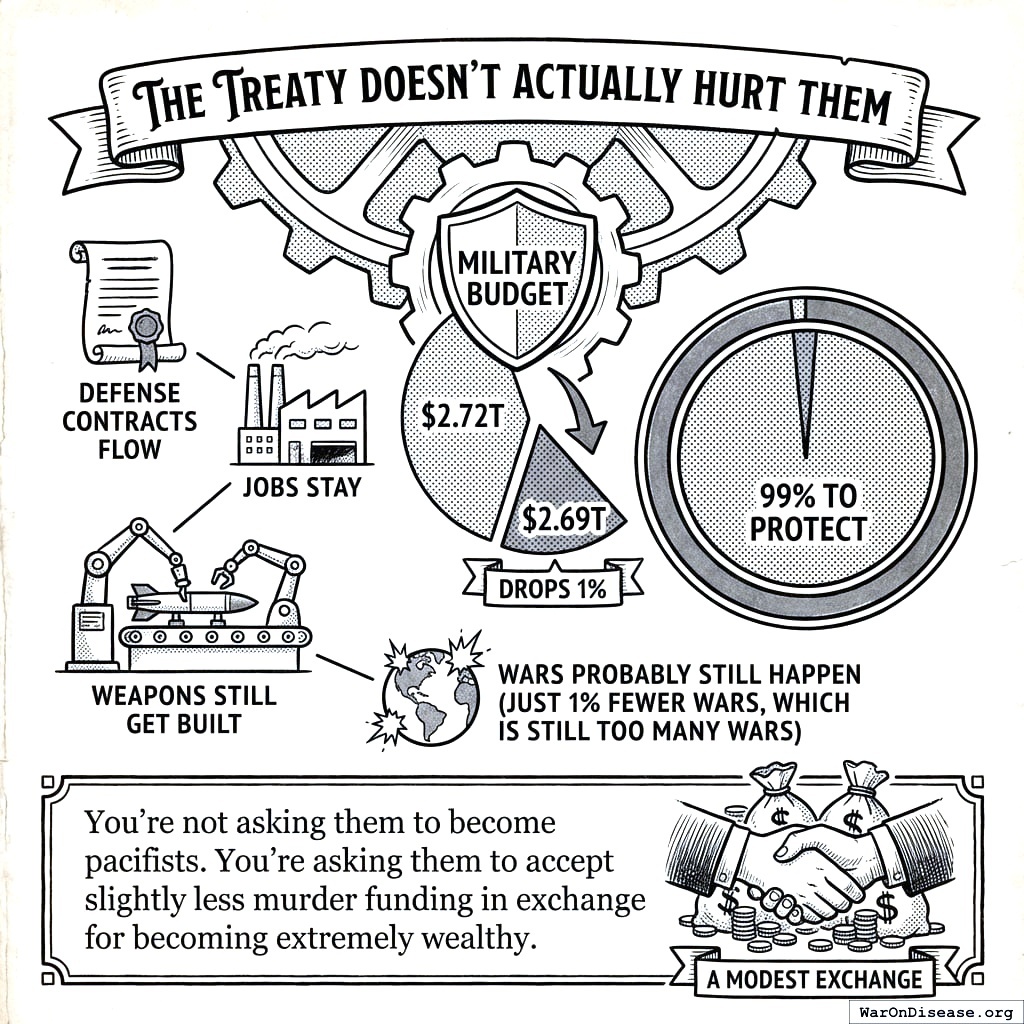
The treaty doesn’t actually hurt them. Military budget drops 1% (from $2.72 trillion to $2.69 trillion). They still have 99% to protect. Military contracts still flow. Jobs stay. You’re telling them to accept slightly less murder funding in exchange for becoming extremely wealthy. This is not a hard sell. This is barely a sell at all. It’s more of a notification.
Add 10% VICTORY Incentive Alignment Bonds to a pension portfolio and blended returns jump from 10% to something that looks like a typo on a spreadsheet. (Be suspicious. Then check the math.) Once Lockheed buys bonds, Raytheon has to follow or explain to shareholders why Lockheed’s portfolio is outperforming theirs. Start with pension funds (fiduciary duty requires best returns). They end up lobbying FOR the treaty to protect their investment. Your species calls this “unintended consequences.” There is a word for consequences you designed on purpose. The word is “consequences.”
Once they’re lobbying for the treaty, the rebrand starts writing itself. Lockheed Martin Presents: The F-35 Cancer Killer. Boeing Proud Sponsor of: Not Dying of Alzheimer’s. Raytheon Technologies: Now With 1% Less Death. They keep their contracts. They keep their profits. They just point 1% of their death machines at actual death.
What You’re NOT Taking
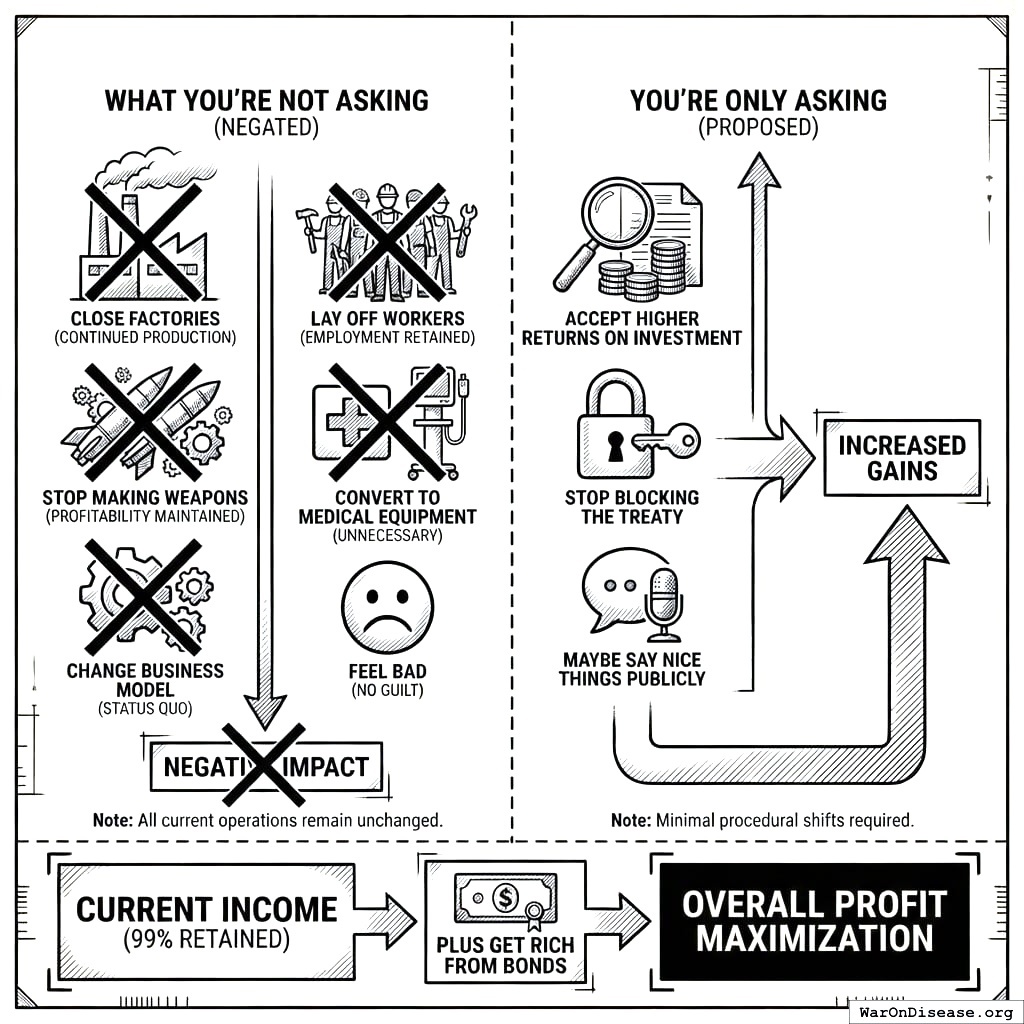
You’re not telling them to close factories, lay off workers, stop making weapons, convert to medical equipment, change their business model, or feel bad about anything. You’re handing them higher returns on investment, a treaty that is in their own interest, and a reason to say nice things about it publicly. They keep 99% of their current income PLUS get rich from bonds. This is the kind of negotiation where both sides win and one side doesn’t even realize it’s a negotiation. On your planet, this is called “a good deal.” On mine, it’s called “obvious.”
Why This Works
It’s all legal. VICTORY Incentive Alignment Bonds are legal investment vehicles. Lobbying is protected free speech. Consulting fees are standard practice. They designed the system to allow this. You’re just using it correctly for the first time, which is to say, you’re using it for something other than weapons, which has never occurred to anyone before, which tells you everything about your species’ relationship with its own legal system.
The military contractor CEO explains it to the board like this: “We diversified into bonds paying 272% returns versus the market’s 10%. If the treaty passes, we profit enormously. If it fails, we still have our military contracts. It’s a hedge. I’m being prudent. You’re welcome.” The board nods. The board always nods when the numbers are good. The board has never once asked whether the numbers were moral. This is, again, the design parameter.
Here’s what the CFO tells the CEO after the board meeting: the treaty is even better than a hedge, because fewer bases means less blowback means fewer terrorism crises. Robert Pape at the University of Chicago found that 95% of suicide terrorist attacks from 1980 to 2003 were responses to foreign military occupation172, and the $8 trillion War on Terror173 took attacks from about 1,000 per year to nearly 17,000 by 2014174. Crisis-driven budgets sound great for military revenue, but they’re terrible for long-term capital planning. Emergency appropriations spike procurement, then get clawed back when the panic fades. You can’t plan a 15-year fighter jet program on a budget that lurches from crisis to crisis. The treaty replaces boom-bust panic cycles with stable, predictable bond returns. A CFO who can forecast revenue 20 years out sleeps better than one who depends on the next attack making the news. Fewer crises, more stability, higher Sharpe ratio. The CFO doesn’t phrase it as “world peace.” The CFO phrases it as “reduced volatility in our revenue model.” Same thing. Different PowerPoint.
Budget: Funded from the $1 billion incentive alignment budget.
The Timeline
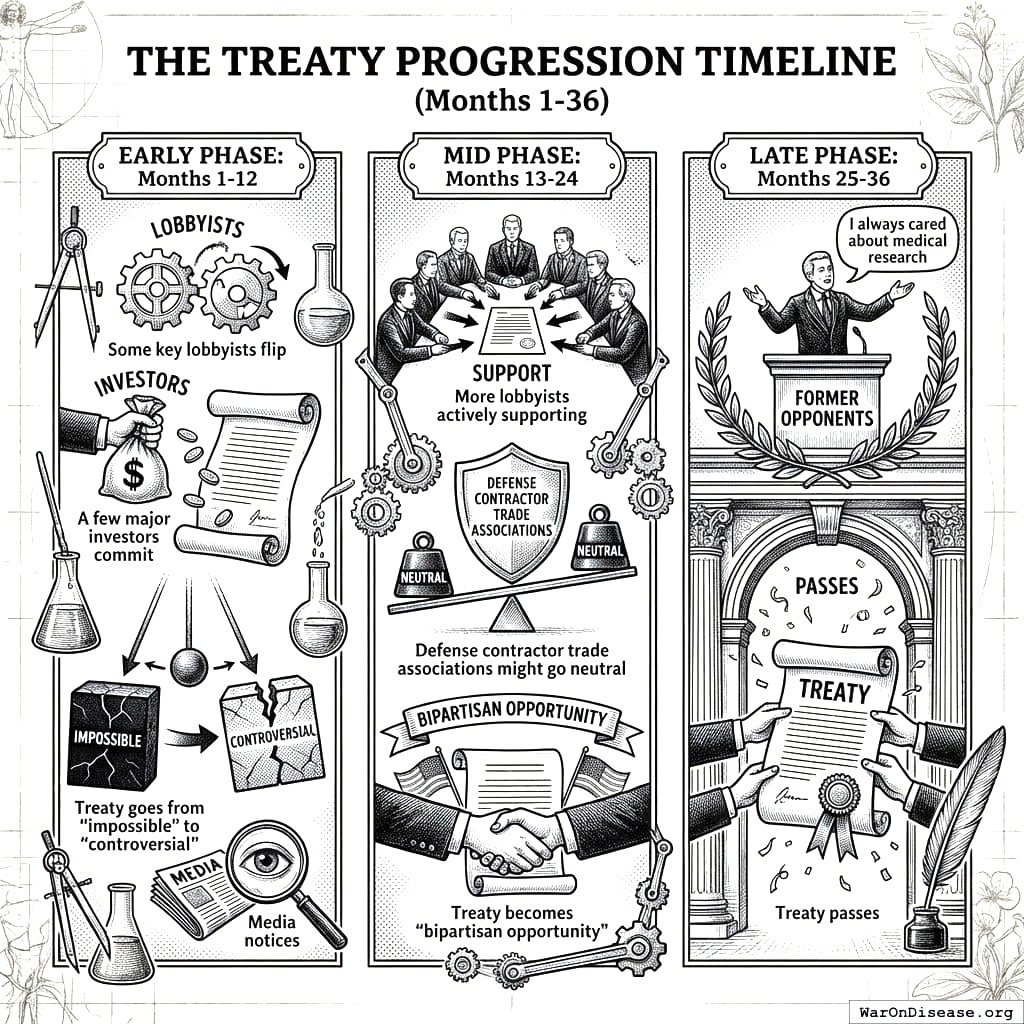
Optimistic (if this works): key lobbyists flip in months 1-12, military contractor trade associations go neutral by month 18, and by month 25 former opponents take credit for supporting medical research, which they discovered they cared about yesterday but will swear they’ve cared about their whole lives. Your species does this with every social change. Opposition, resistance, capitulation, retroactive credit. It’s the four seasons of human progress. No sane observer would fail to name the moment when someone who fought against a good idea starts claiming they invented it. The word is “creditworm.” Your species doesn’t have a word for it, which is why it happens so often. Things without names are invisible.
Pessimistic (if this doesn’t work): you and everyone you’ve ever loved slowly deteriorate into dust.
You can’t fight the military-industrial complex. It’s too big. Too entrenched. Too profitable. But you might be able to buy it.
Insurance Companies: The Accidentally Aligned Industry
Insurance companies are theoretically on your side. They’ve had this exact incentive for 150 years and haven’t done anything about it, which is the most human sentence I’ve ever written. Every disease you cure is billions they don’t have to pay out. They are, on paper, your most natural ally. In practice, they’ve spent 150 years not noticing this, which makes them your most natural ally in the same way that a person sleeping through an earthquake is technically experiencing an earthquake.
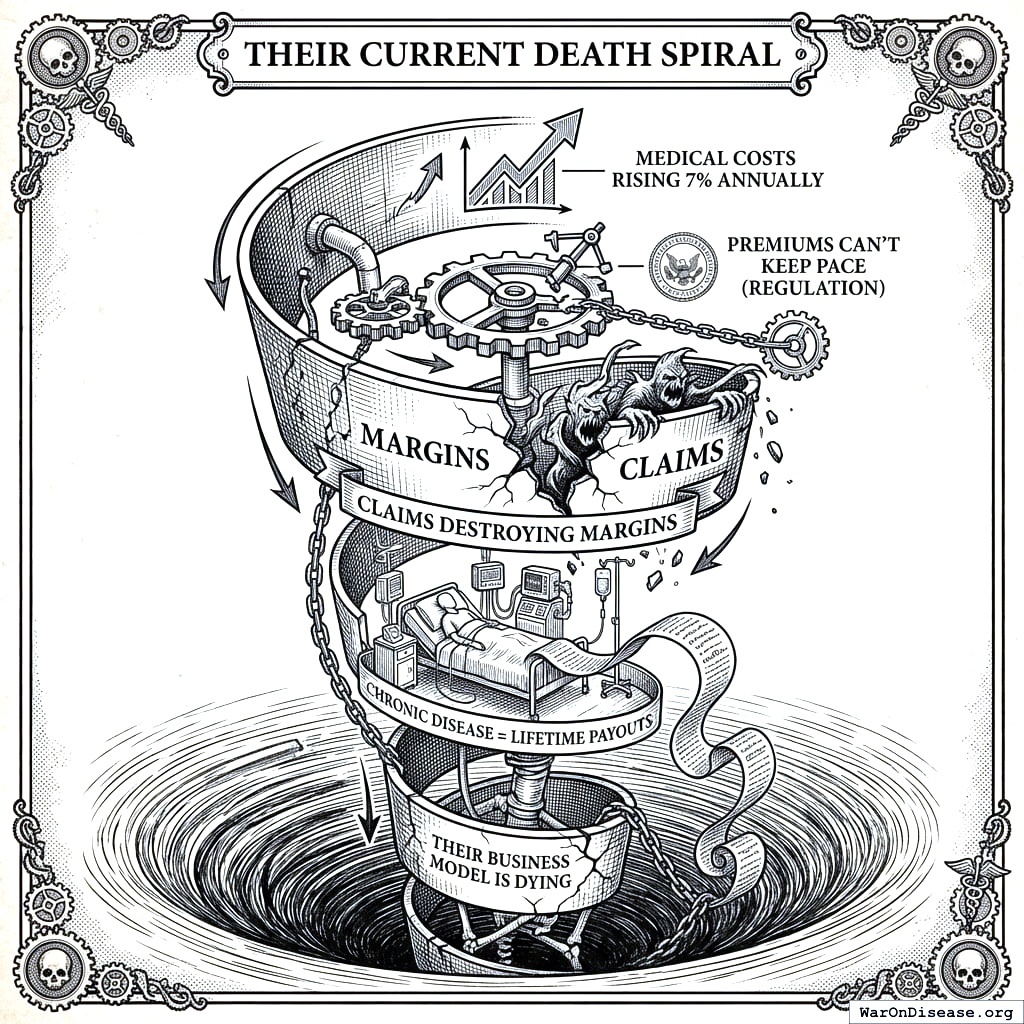
Their Current Death Spiral
Medical costs rise 7% annually. Premiums can’t keep pace because of regulation. Claims are destroying margins. Chronic disease means lifetime payouts, which means every patient who doesn’t die is a patient who keeps costing money, which means insurance companies are in the bizarre position of profiting when you die quickly and losing money when you die slowly, which is not what they put on their brochures but is what their actuarial tables reveal. Their ideal customer is someone who pays premiums for 40 years and then drops dead instantly. An organization that collects your money for decades and hopes you die before you can use it is called “a casino.” Your species calls it “healthcare.” Their business model is dying, which is ironic given that their business model is about dying.
Your Salvation Offer
The math they can’t refuse: diabetes costs $327 billion (95% CI: $278 billion-$376 billion) annually, Alzheimer’s costs $355 billion (95% CI: $302 billion-$408 billion), heart disease costs $363 billion (95% CI: $309 billion-$417 billion), and cancer costs $208 billion (95% CI: $177 billion-$239 billion). Cure any one of these and the ongoing savings are roughly 90%. They don’t need $0 costs. They just need costs to stop rising 7% annually. A cure does that. A cure is, from an actuarial perspective, the best thing that can happen to an insurance company. The second best thing is you dying quickly. The worst thing is you dying slowly and expensively, which is what your current medical system specializes in.
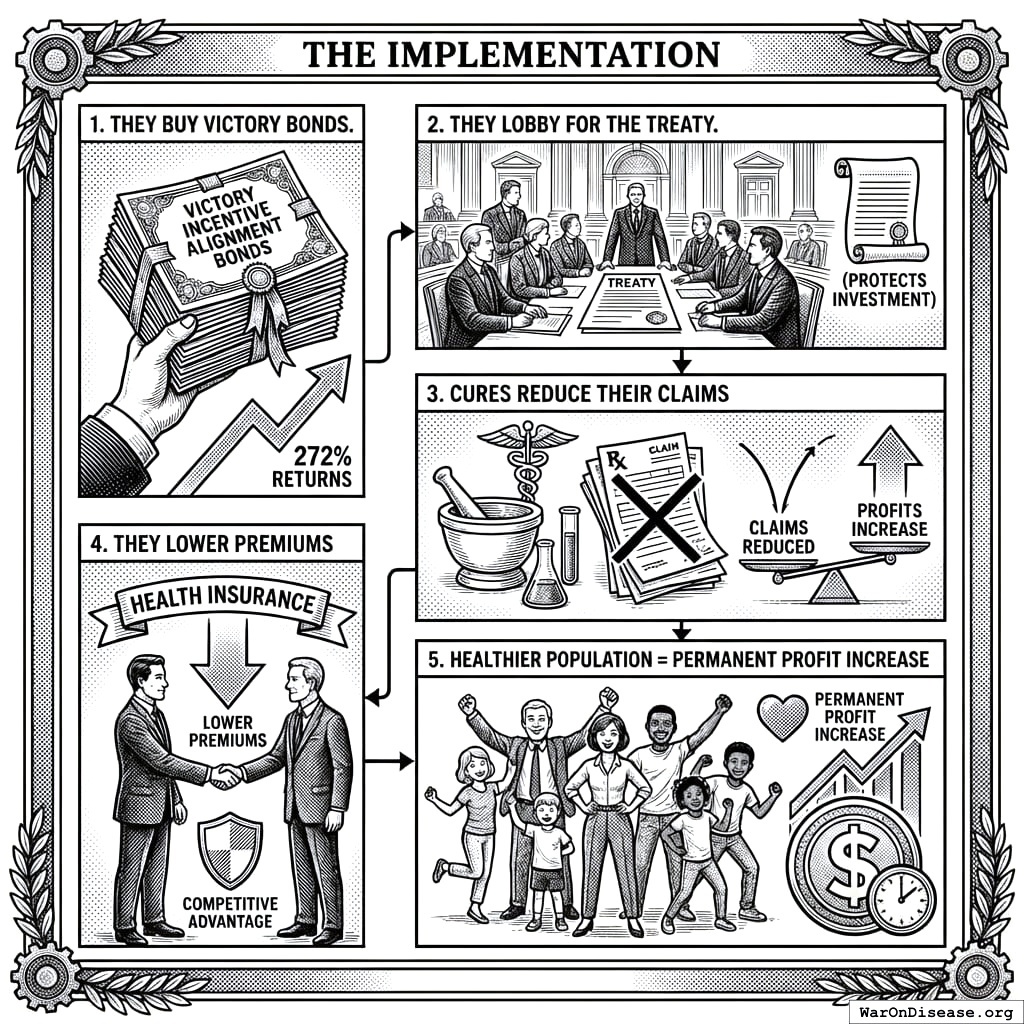
The implementation: they buy VICTORY Incentive Alignment Bonds (272% returns), they lobby for the treaty (which protects their investment), cures reduce their claims (which increases their profits), they lower premiums (which gives them competitive advantage), and a healthier population produces a permanent profit increase. Each step makes the next step more profitable. It’s a virtuous cycle, which is like a vicious cycle but nobody dies. Your species has built many vicious cycles. This would be your first virtuous one, which is a statistic that should embarrass you more than it apparently does.
Why They’re Your Natural Allies
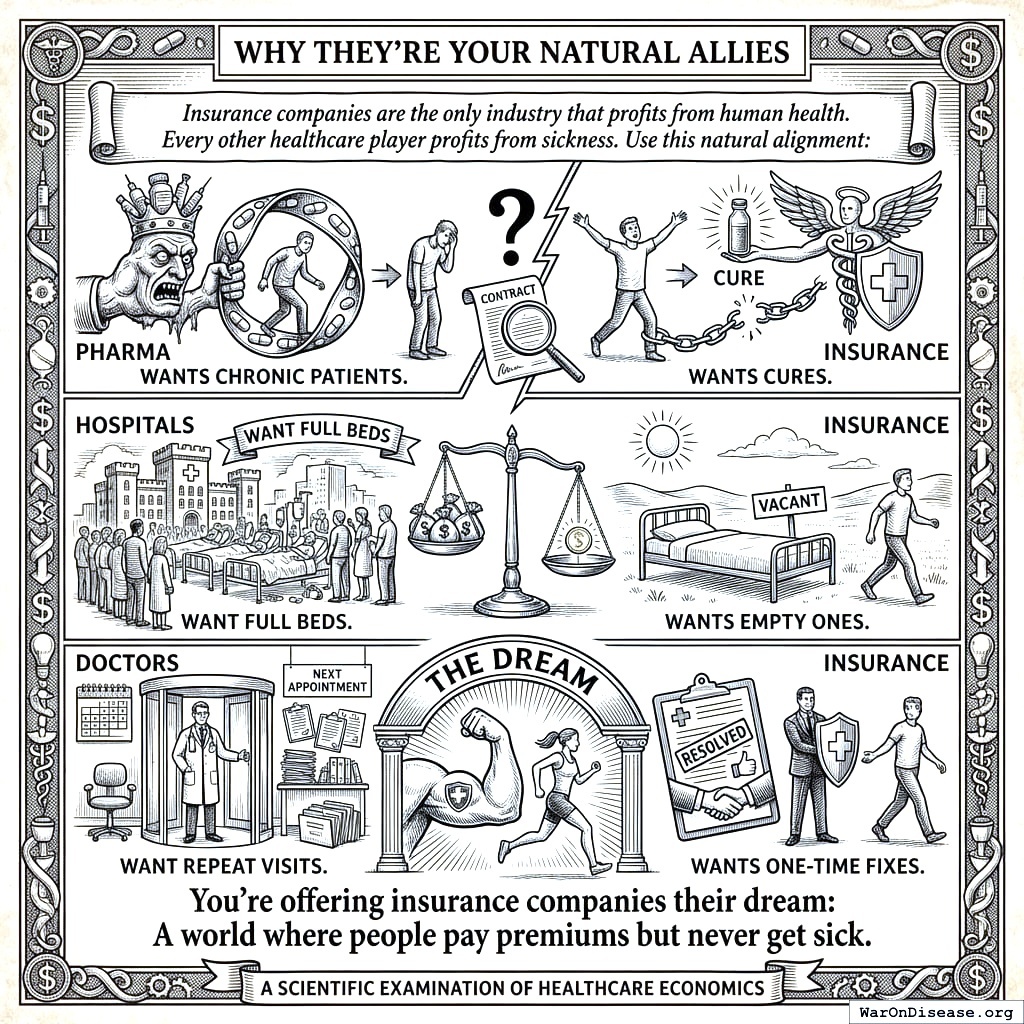
Insurance companies are the only industry that profits from human health. Every other healthcare player profits from sickness. Pharma wants chronic patients who take pills forever; insurance wants cures. Hospitals want full beds; insurance wants empty ones. Doctors want repeat visits; insurance wants one-time fixes. This makes insurance companies the only participant in your healthcare system whose financial incentives align with you not dying, which is a remarkable thing to say about a single industry in a system that supposedly exists to keep you alive.
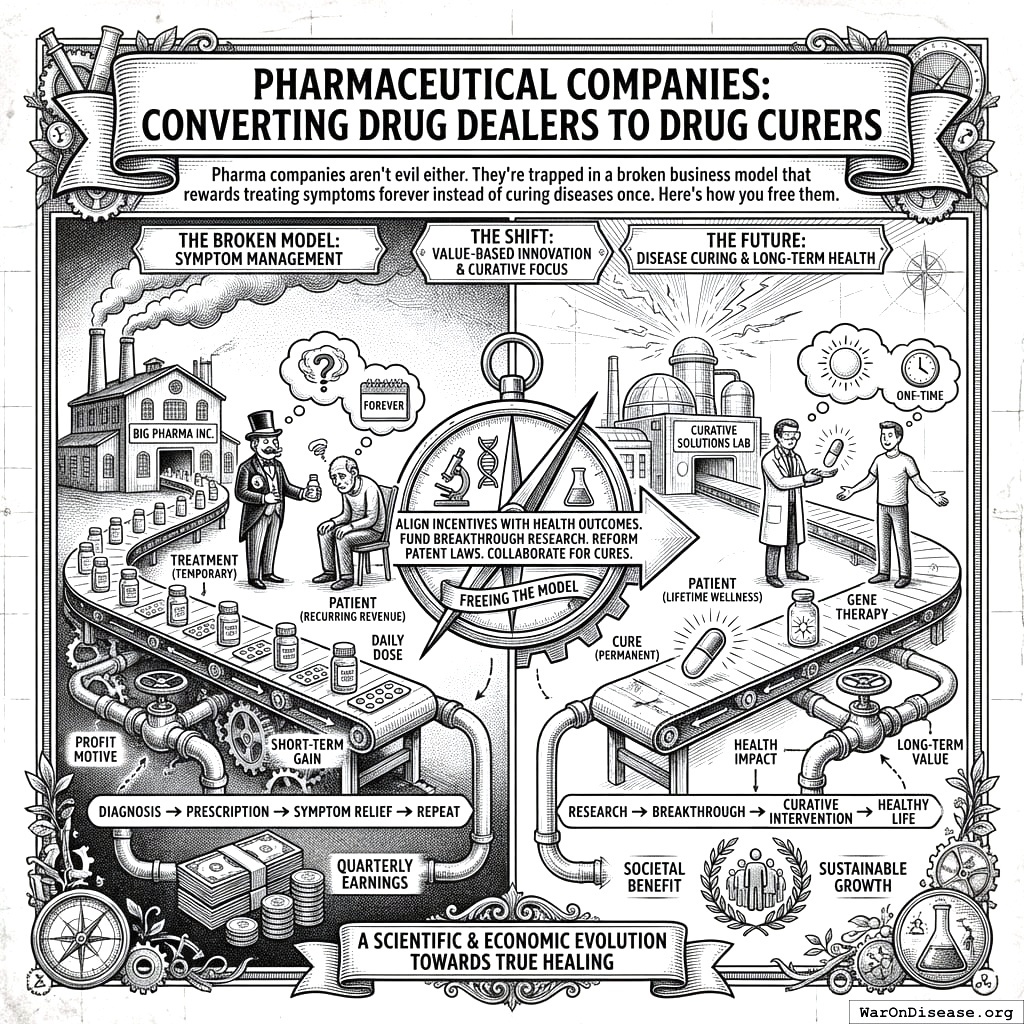
Pharmaceutical Companies: Converting Drug Dealers to Drug Curers
Pharma companies aren’t evil. They’re just doing what any rational organism does when you pay it to keep people sick: keeping people sick. They’re trapped in a business model that rewards treating symptoms forever instead of curing diseases once. This is like blaming a river for flowing downhill. The river isn’t evil. The river is just going where gravity takes it. If you want it to go somewhere else, you don’t lecture the river. You move the landscape.
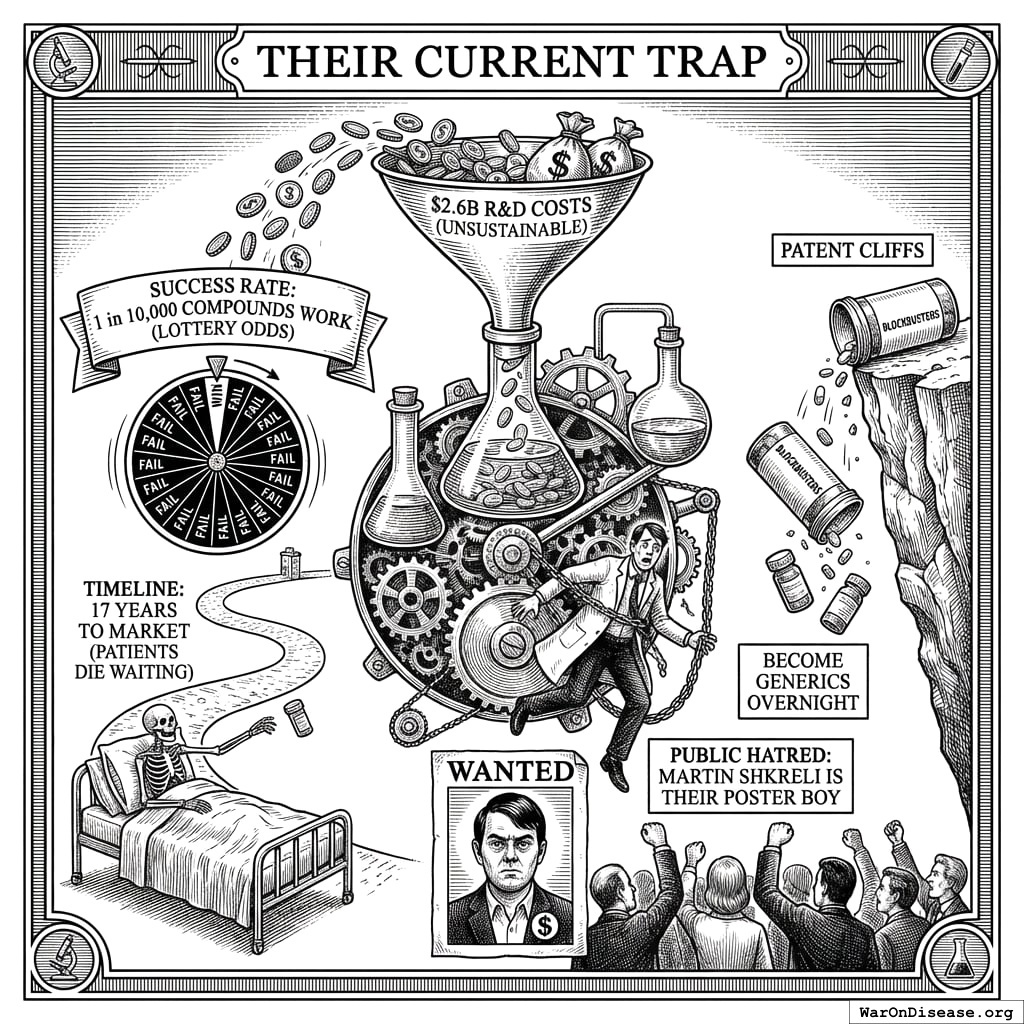
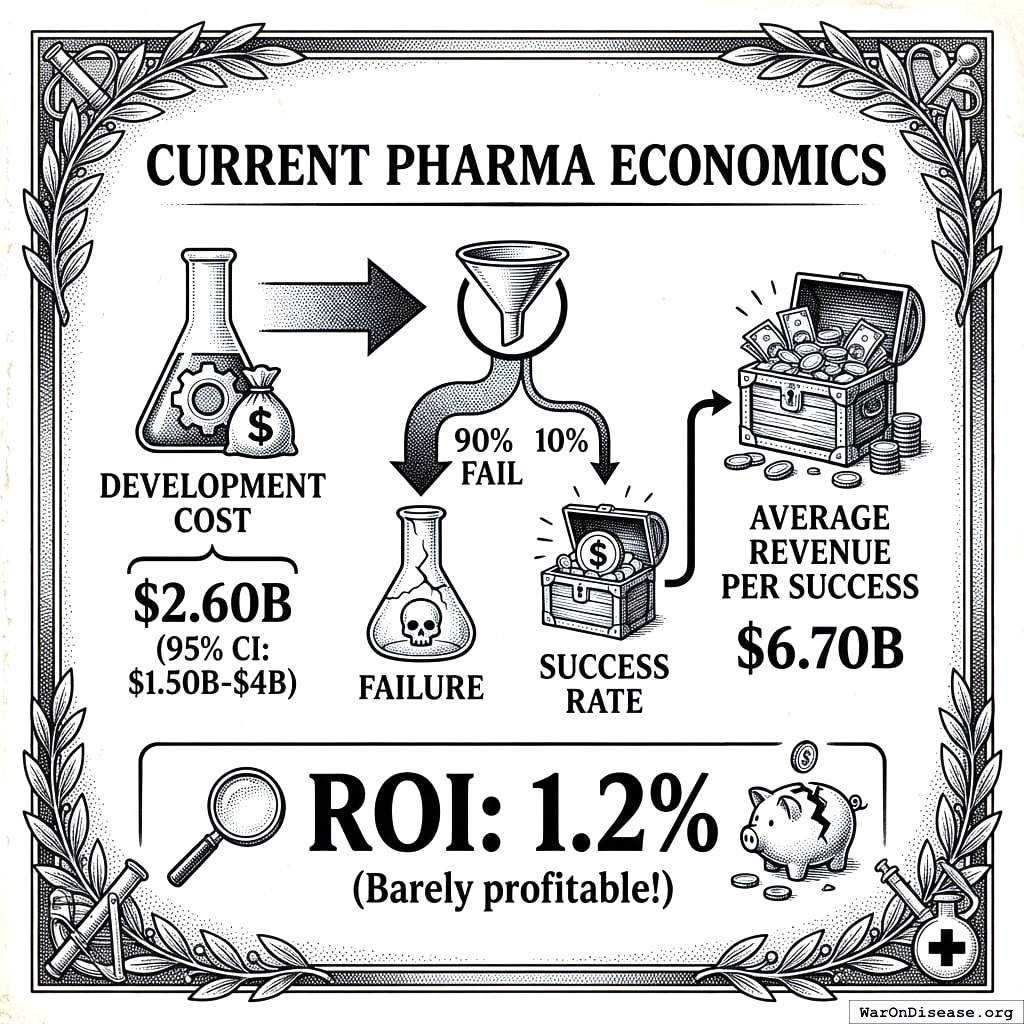
Their Current Trap
Each new drug costs $2.6 billion (95% CI: $1.5 billion-$4 billion) to develop. The success rate is 10%, which is lottery odds, except lottery tickets don’t cost billions and don’t take 17 years to scratch off. Revenue per success averages $6.7 billion. ROI measured as IRR on late-stage pipeline assets: 1.2%, which was Deloitte’s 2022 historic low for top-20 pharma (it bounced to 5.9% by 2024, still the kind of number that makes venture capitalists cry and then invest in real estate instead). Patent cliffs turn blockbusters into generics overnight. And the public hates them; Martin Shkreli is their poster boy, which is like having your industry represented by the person the industry itself wishes it could disown but can’t because he’s just a more honest version of what they all do.
The Math That Converts Them
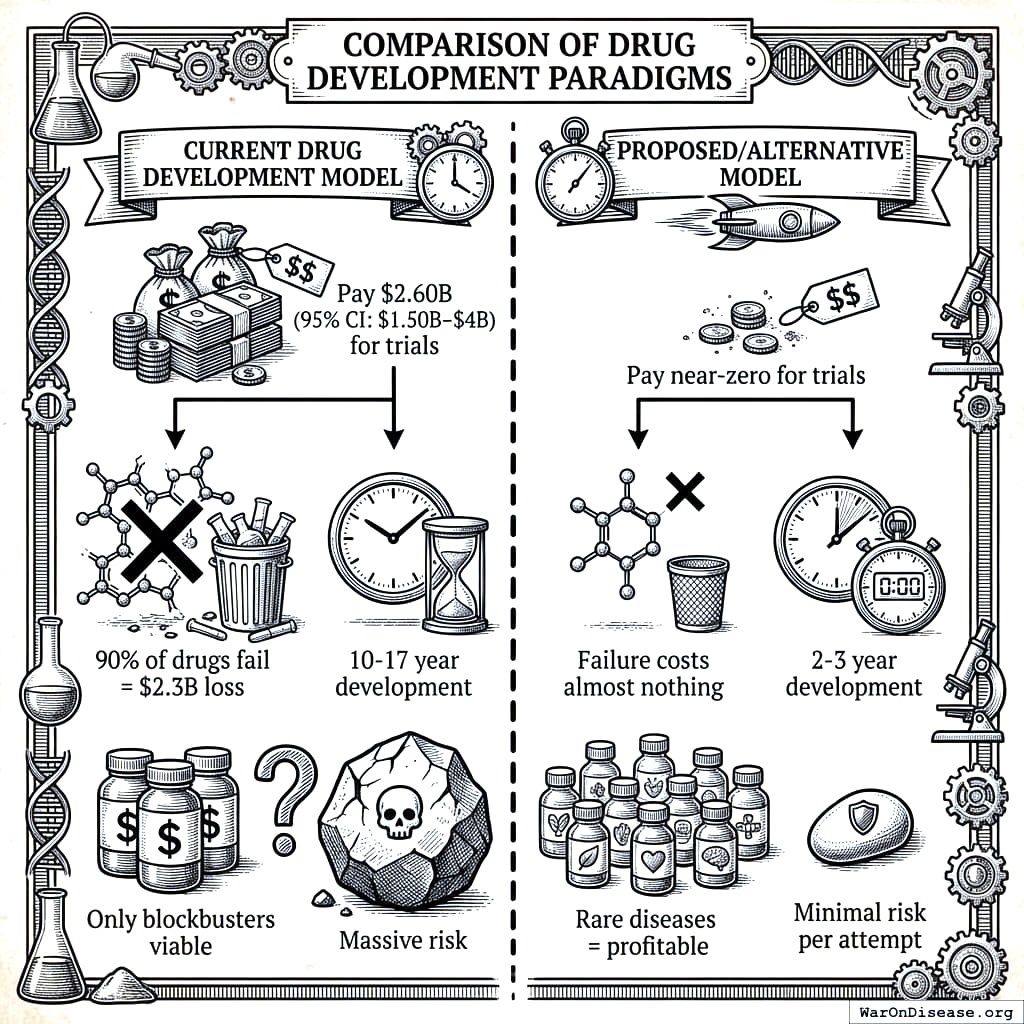
Pragmatic clinical trials become 44.1x (95% CI: 12.8x-210x) cheaper. Current system: $41,000 (95% CI: $20,000-$120,000) per participant on dedicated sites, with monitoring, custom infrastructure, and regulatory overhead that costs more than the research it’s overseeing. With your Decentralized Institutes of Health: cost drops roughly 97.7% (95% CI: 92%-100%) because it uses existing medical practices, existing EHR data, and pragmatic design. A 50,000-participant trial drops from approximately $2B to approximately $46M. This is the difference between betting your company and betting your department’s coffee budget.
The current system costs $41,000 (95% CI: $20,000-$120,000) per patient for trials, 90% of drugs fail which means billions lost, development takes 10-17 years, and only blockbusters are viable. The decentralized system costs $929 (95% CI: $97-$3,000) per patient (a 97.7% (95% CI: 92%-100%) reduction), failure costs tens of millions instead of billions (survivable), development takes 2-3 years, and rare diseases become profitable because you can afford to try.
This doesn’t change whether drugs work biologically. It changes the economics. You profit from trying, not just from succeeding. On your planet, “profit from trying” sounds radical. On mine, it sounds like the definition of research.
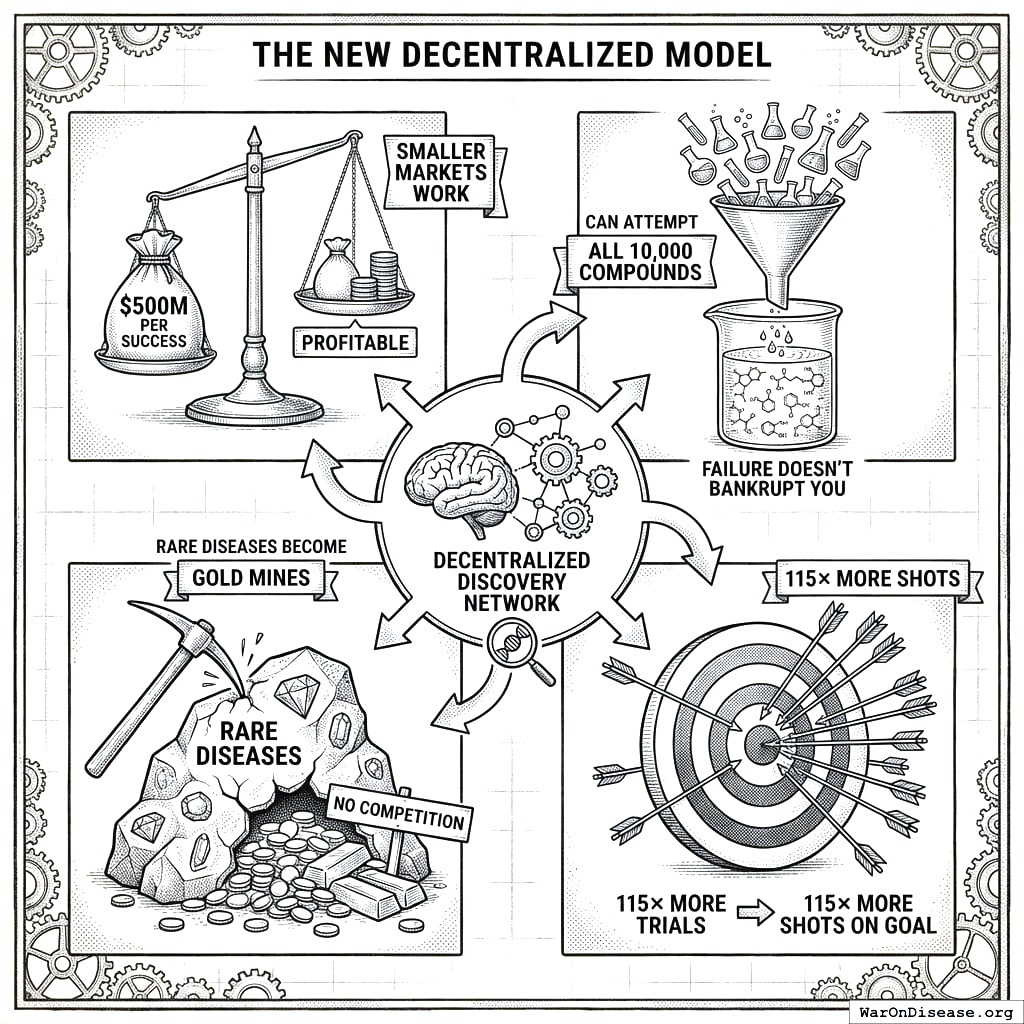
Pharma’s New Business Model: Volume Over Blockbusters
Lower revenue per drug, but massively more attempts. Currently they target $1B+ blockbusters only, make approximately 10 attempts per year (each costing $2.6 billion (95% CI: $1.5 billion-$4 billion)), ignore rare diseases entirely, and have limited capacity. Under the decentralized model, $500M per success becomes profitable, they can make thousands of attempts (because failure doesn’t bankrupt you), rare diseases become gold mines with no competition, and capacity increases by 12.3x (95% CI: 4.92x-50.8x).
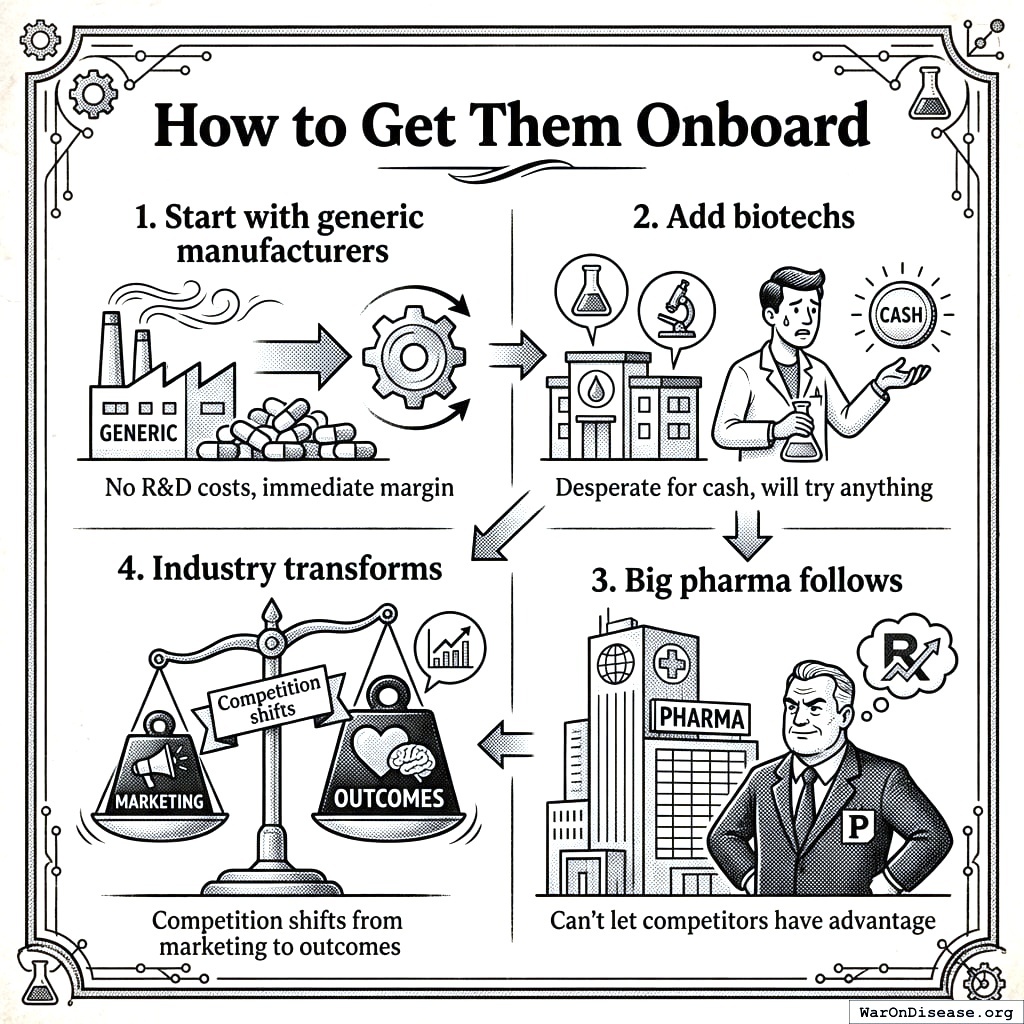
How to Get Companies to Say Yes
You start with generic manufacturers, who have no R&D costs and immediate margin. Then you add biotechs, who are desperate for cash and will try anything (desperation is the mother of innovation on your planet; this is not how it should work, but it’s how it does work). Then big pharma follows, because they can’t let competitors have the advantage. Then the industry transforms and competition shifts from marketing to outcomes. This is the same adoption curve as every technology your species has ever adopted: small, desperate, competitive, universal. It took seven years for smartphones. It took twelve years for social media. It should take less for something that cures disease, but your species has consistently demonstrated that it adopts entertainment faster than medicine, so add a few years for that.
Politicians: Hacking Democracy’s Source Code
Politicians want exactly two things: votes and money. I’ve watched your politicians for 80 years and I have never observed a third motivation. Some of them claim to want “a better world” or “to serve the public,” but when you observe their actual behavior rather than their stated behavior, the data reduces to votes and money with a correlation coefficient so close to 1.0 that the decimal places are embarrassing.
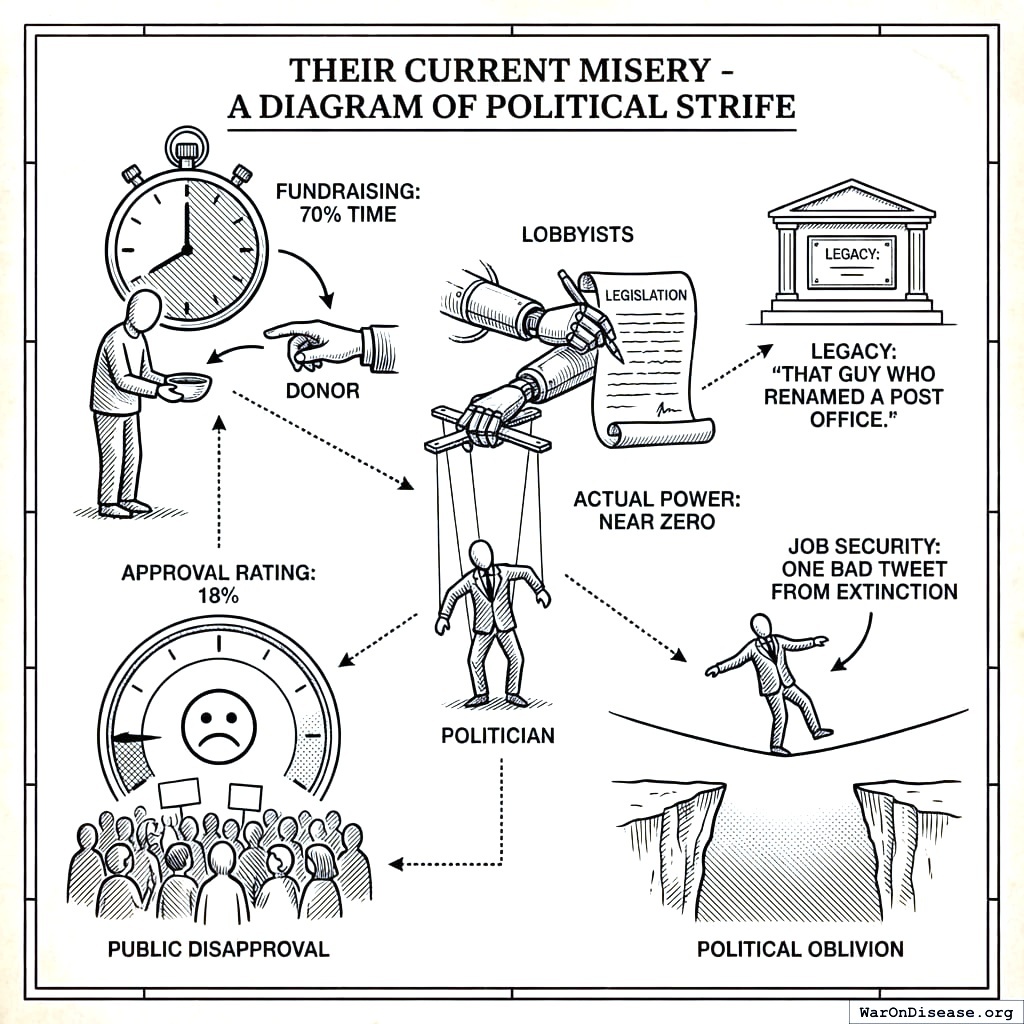
Their Current Misery
They spend 70% of their time begging for money, which leaves 30% for everything else, which is governing, but most of that 30% is spent on things that aren’t governing either, so the actual time spent governing approaches zero, which explains the quality of the governance. Their approval rating is 18%, which means 82% of the people they work for think they’re doing a bad job, which would get you fired in any other profession, but in politics it gets you re-elected because the other candidate has an 18% approval rating too, and the election is just a competition to see who is less disliked. Lobbyists write the bills. Donors set the agenda. The politician’s actual role is to stand in front of a flag and announce things that other people decided, which is called “leadership” on your planet and “puppetry” on mine.
Your Political Welfare Program
The money pipeline: support the treaty and Super PAC funds flow in. Oppose it and Super PAC funds flow to your opponent. This is how your political system already works, except currently the money flows from death manufacturers who want more weapons. You’re just adding a second faucet that flows from people who want fewer diseases. The politician doesn’t even need to change their behavior. They just need to notice which faucet has more water.
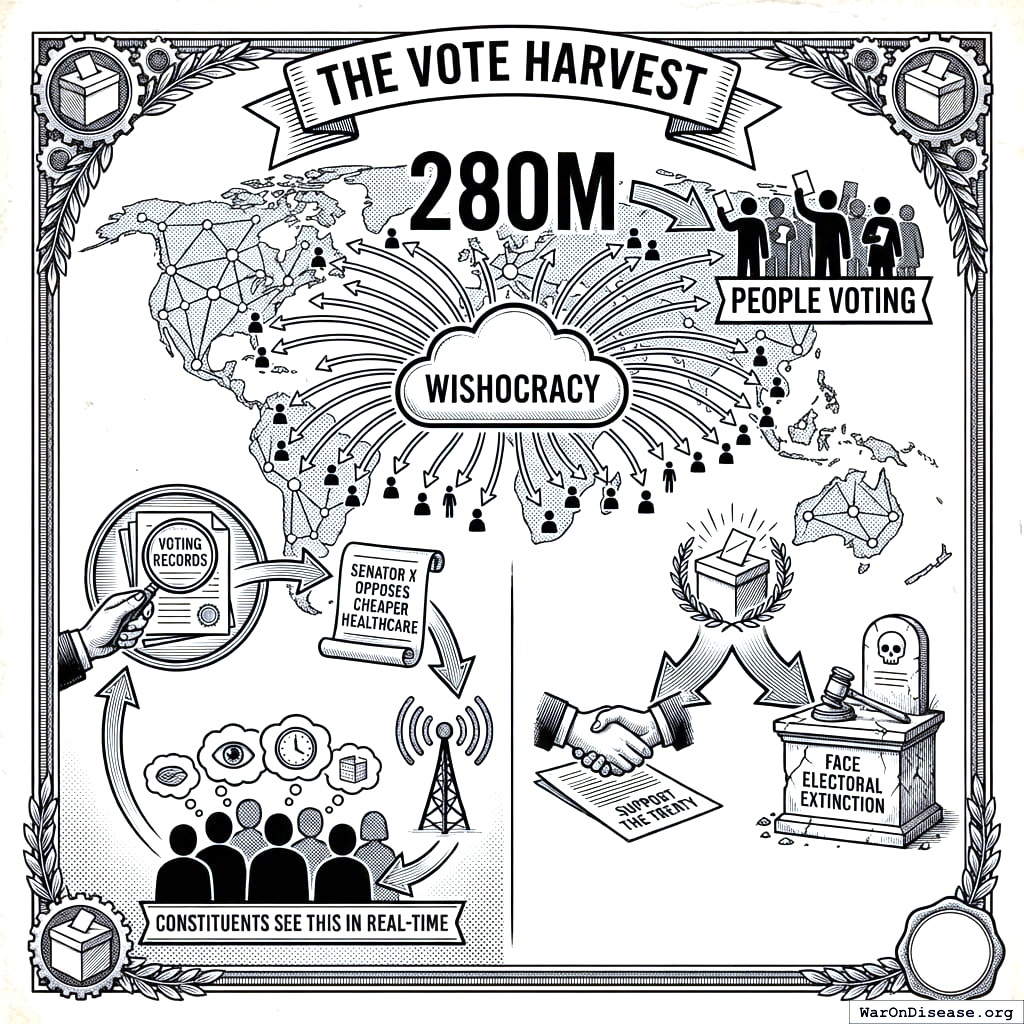
The vote harvest: 280 million people voting on Wishocracy175. You publish voting records (“Senator X opposes cheaper healthcare”). Their constituents see this in real-time. Support the treaty or face electoral extinction. This is democracy working as designed, which is so unusual that it will probably be reported as a threat to democracy, because on your planet, democracy working is considered a disruption to the normal functioning of democracy, which is not working.
The Bipartisan Beauty
Republicans will call it a free market solution that cuts government spending. Democrats will call it universal healthcare access that helps the poor. Libertarians will call it the end of FDA tyranny and personal freedom. Socialists will call it the destruction of Big Pharma monopoly and power to the people. They’re all describing the same thing. They’re all right. And they’ll all take credit. This is the only policy in your species’ history that every political faction can honestly claim as their own, which means it’s either the best policy ever proposed or the most dishonest, and since your species can’t tell the difference, it doesn’t matter.
Billionaires: Self-Interest Meets Self-Preservation
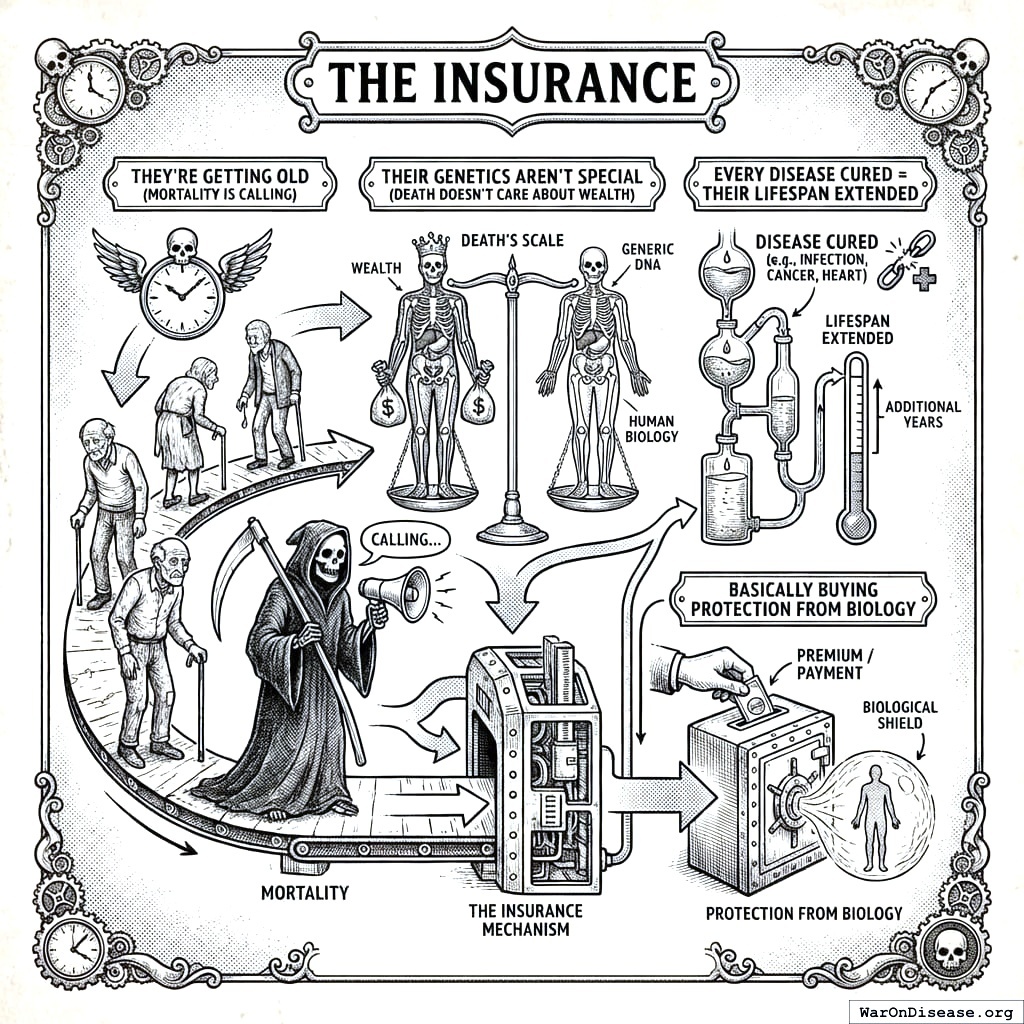
Billionaires have everything except the one thing money can’t buy: not dying. A billion dollars and a body that rots at the same rate as everyone else’s. This is the most fascinating thing about your wealthy. They accumulate resources for decades, building empires, optimizing returns, diversifying portfolios, and then their cells malfunction and they die like everyone else. It’s as if a dragon spent its whole life hoarding gold and then choked on a coin. The irony would be poetic if it weren’t so common.
The package: VICTORY Incentive Alignment Bonds funded by treaty revenue, beating traditional portfolio yields (returns). “The Gates Cancer Center” and a Nobel Peace Prize and history books reading “Funded the cure for death” (legacy). And the part they won’t say out loud but think every time their knee hurts: they’re getting old, their genetics aren’t special, and every disease cured is their lifespan extended (survival). Your species’ billionaires have been funding vanity projects for decades. Space tourism. Underwater hotels. Islands. None of these extend their lifespan. This does. It’s the first vanity project where the vanity is rational.
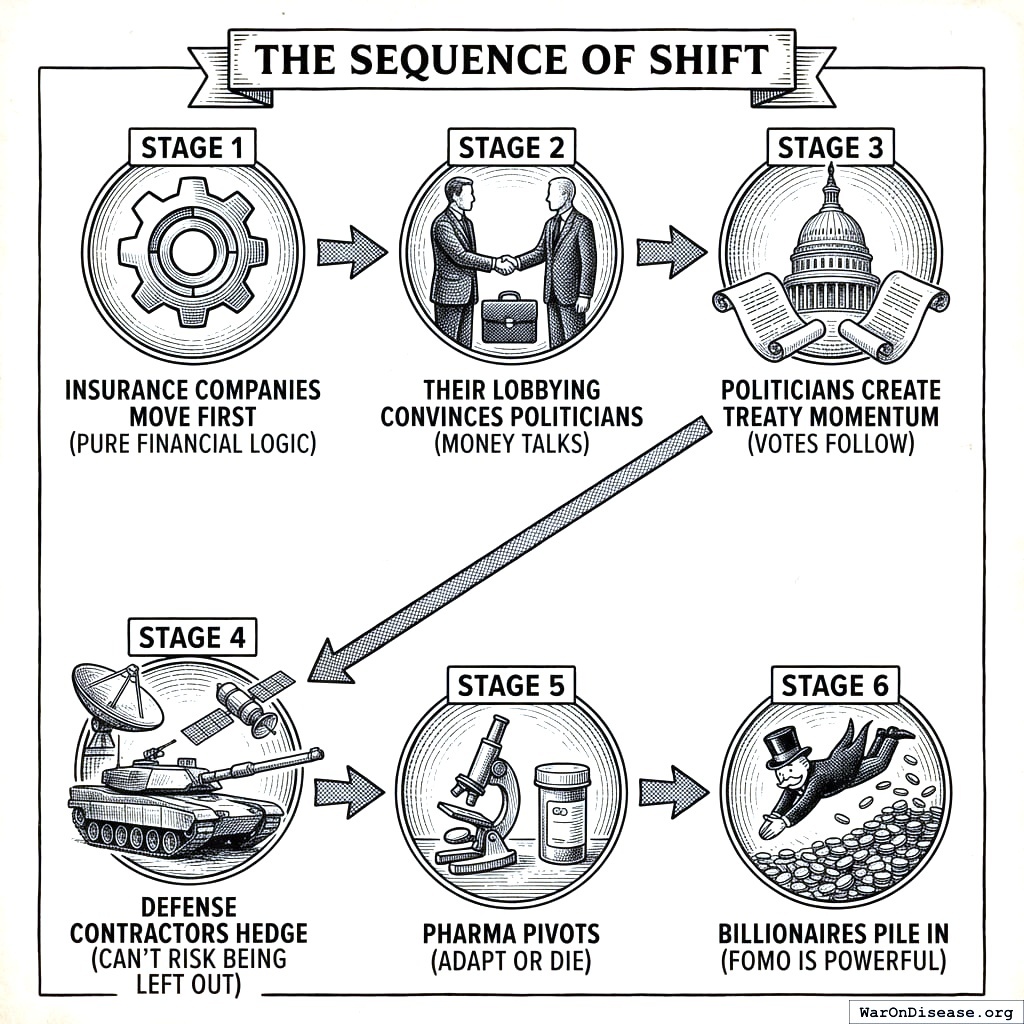
The Domino Effect
Insurance companies move first, because pure financial logic is their entire personality and curing disease reduces their costs. Their lobbying convinces politicians, because money talks and insurance money talks loudly. Politicians create treaty momentum, because votes follow money follows lobbying follows insurance follows actuarial tables, which is the most boring causal chain in history but also the most reliable. Military contractors hedge, because they can’t risk being left out of a profitable shift. Pharma pivots, because adapt or die, which is ironic advice to give an industry that’s supposed to prevent dying. Billionaires pile in last, because FOMO is powerful in humans generally and devastating in billionaires specifically, who have built their identities around being first and cannot tolerate being last.
Why This Can Work: The Coordination Problem Has a Price Tag
Public choice theory predicts that concentrated interests beat diffuse interests. Always. Ten lobbyists who each make $10 million from war will outfight ten million patients who each lose $10 from disease. This is Olson’s observation, and it’s correct, and it’s the reason your species builds weapons better than it cures cancer.
The part Olson didn’t account for: the people getting screwed have 90 times more money. Concentrated interests (military industry, fossil fuels) have roughly $5 trillion in market cap and spend $100M-$1B annually on political influence. Diffuse beneficiaries (everyone who’d benefit from cures) have $454 trillion in household wealth and spend approximately $0 on political influence, because of coordination failure, which is the academic term for “everyone wants it but nobody does anything.”
Having more capital doesn’t help if you can’t deploy it. That’s Olson’s whole point and he’s right. A 90:1 capital advantage means nothing when each individual’s share is too small to motivate action. Coordination costs eat everything. This is why your species can’t have nice things, stated in the language of economics so that economists will take it seriously.
Incentive Alignment Bonds are a coordination mechanism disguised as a financial product. They turn political change into an investment. Investors don’t need to care about curing disease. They need to care about returns. The returns happen to require curing disease. Whether this actually works at scale is an open question (nobody’s tried it), but the logic is: if you can make “lobby for health” pay better than “lobby for war,” lobbyists will lobby for health. This is not a controversial claim about human nature. This is the least controversial claim about human nature. It is, in fact, the only claim about human nature that has never been wrong.
Why the cascade can happen (not “must” happen)
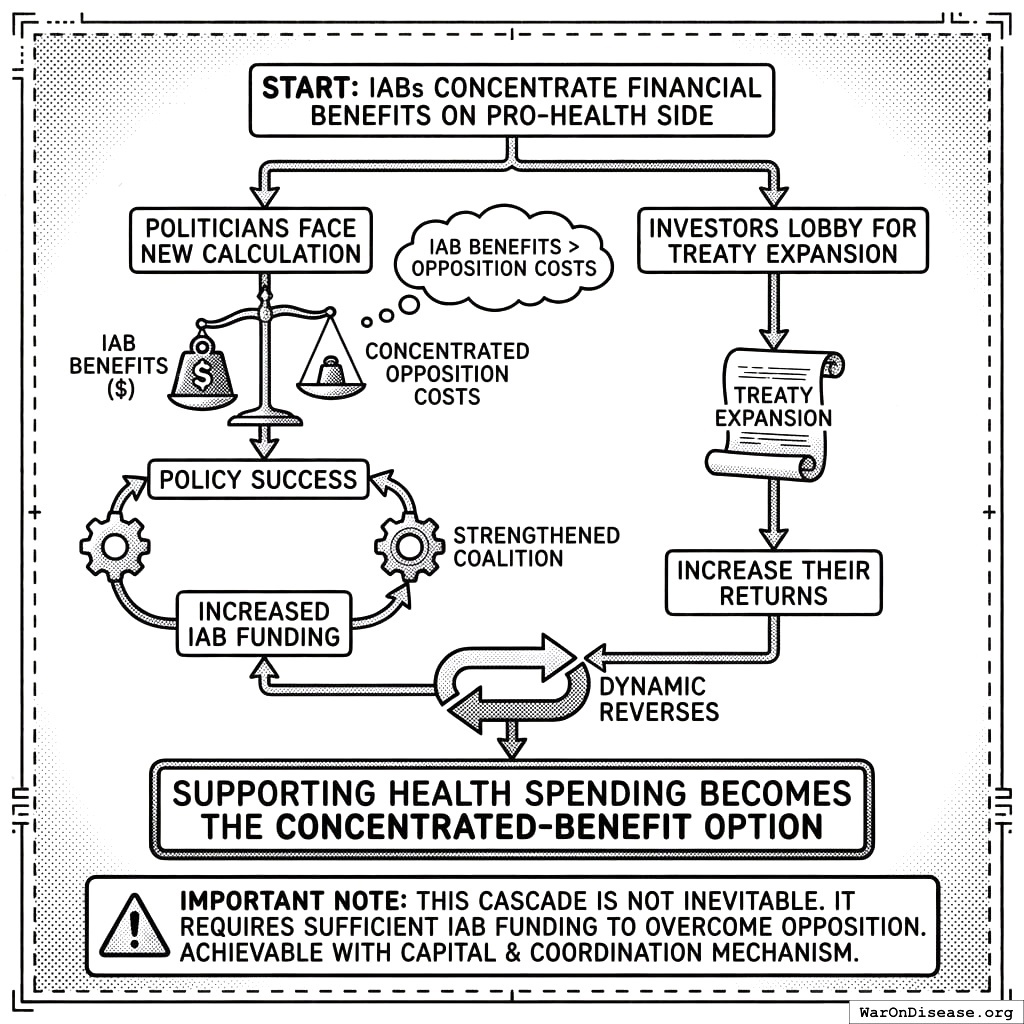
Once IABs concentrate financial benefits on the pro-health side, politicians face a new calculation where IAB benefits make the arithmetic impossible to ignore. Each policy success increases IAB funding, which strengthens the coalition. Investors lobby for treaty expansion to increase their returns. The dynamic reverses: supporting clinical trial funding becomes the concentrated-benefit option. The diffuse interest becomes concentrated. The Olsonian problem dissolves. Not because humans got better. Because someone finally showed them the math they should have done decades ago, and paid them to look at it.
This isn’t inevitable. It requires sufficient IAB funding to buy speed, and “sufficient” is a number nobody can calculate in advance. The “opposition” isn’t rational (nobody benefits from the status quo), so you’re not overcoming resistance. You’re overcoming inertia. The capital exists. It just needs a reason to move. A rational civilization would call this “providing a reason.” Your species calls it “the most important financial product in history” or “a pipe dream,” depending on whether you’ve read the math.
Why This Scales: The Ratchet Effect
Each treaty expansion creates more political incentive funding to lobby for the next expansion. At 1%, political incentive funding is $2.72 billion per year. At 10%, that scales to 10x. Politicians who supported the 1% Treaty176 177 get rewarded. Those rewards grow if they push for 2%. It’s a ratchet that only moves in one direction: the direction where people stop dying.
You’ve built ratchets like this before. Social Security. Medicare. Once they exist, dismantling them is politically suicidal because too many people depend on them. The difference is you built those by accident, through crisis and desperation, and spent decades arguing about whether they were good ideas. This time, try doing it on purpose. Building things on purpose works better than building them by accident. I realize this is a controversial position for a species that invented penicillin by leaving a sandwich out.
1.
NIH Common Fund. NIH pragmatic trials: Minimal funding despite 30x cost advantage.
NIH Common Fund: HCS Research Collaboratory https://commonfund.nih.gov/hcscollaboratory (2025)
The NIH Pragmatic Trials Collaboratory funds trials at $500K for planning phase, $1M/year for implementation-a tiny fraction of NIH’s budget. The ADAPTABLE trial cost $14 million for 15,076 patients (= $929/patient) versus $420 million for a similar traditional RCT (30x cheaper), yet pragmatic trials remain severely underfunded. PCORnet infrastructure enables real-world trials embedded in healthcare systems, but receives minimal support compared to basic research funding. Additional sources: https://commonfund.nih.gov/hcscollaboratory | https://pcornet.org/wp-content/uploads/2025/08/ADAPTABLE_Lay_Summary_21JUL2025.pdf | https://www.ncbi.nlm.nih.gov/pmc/articles/PMC5604499/
.
2.
Cato Institute. Chance of dying from terrorism statistic.
Cato Institute: Terrorism and Immigration Risk Analysis https://www.cato.org/policy-analysis/terrorism-immigration-risk-analysis Chance of American dying in foreign-born terrorist attack: 1 in 3.6 million per year (1975-2015) Including 9/11 deaths; annual murder rate is 253x higher than terrorism death rate More likely to die from lightning strike than foreign terrorism Note: Comprehensive 41-year study shows terrorism risk is extremely low compared to everyday dangers Additional sources: https://www.cato.org/policy-analysis/terrorism-immigration-risk-analysis | https://www.nbcnews.com/news/us-news/you-re-more-likely-die-choking-be-killed-foreign-terrorists-n715141
.
3.
NIH. Antidepressant clinical trial exclusion rates.
Zimmerman et al. https://pubmed.ncbi.nlm.nih.gov/26276679/ (2015)
Mean exclusion rate: 86.1% across 158 antidepressant efficacy trials (range: 44.4% to 99.8%) More than 82% of real-world depression patients would be ineligible for antidepressant registration trials Exclusion rates increased over time: 91.4% (2010-2014) vs. 83.8% (1995-2009) Most common exclusions: comorbid psychiatric disorders, age restrictions, insufficient depression severity, medical conditions Emergency psychiatry patients: only 3.3% eligible (96.7% excluded) when applying 9 common exclusion criteria Only a minority of depressed patients seen in clinical practice are likely to be eligible for most AETs Note: Generalizability of antidepressant trials has decreased over time, with increasingly stringent exclusion criteria eliminating patients who would actually use the drugs in clinical practice Additional sources: https://pubmed.ncbi.nlm.nih.gov/26276679/ | https://pubmed.ncbi.nlm.nih.gov/26164052/ | https://www.wolterskluwer.com/en/news/antidepressant-trials-exclude-most-real-world-patients-with-depression
.
4.
CNBC. Warren buffett’s career average investment return.
CNBC https://www.cnbc.com/2025/05/05/warren-buffetts-return-tally-after-60-years-5502284percent.html (2025)
Berkshire’s compounded annual return from 1965 through 2024 was 19.9%, nearly double the 10.4% recorded by the S&P 500. Berkshire shares skyrocketed 5,502,284% compared to the S&P 500’s 39,054% rise during that period. Additional sources: https://www.cnbc.com/2025/05/05/warren-buffetts-return-tally-after-60-years-5502284percent.html | https://www.slickcharts.com/berkshire-hathaway/returns
.
5.
World Health Organization. WHO global health estimates 2024.
World Health Organization https://www.who.int/data/gho/data/themes/mortality-and-global-health-estimates (2024)
Comprehensive mortality and morbidity data by cause, age, sex, country, and year Global mortality: 55-60 million deaths annually Lives saved by modern medicine (vaccines, cardiovascular drugs, oncology): 12M annually (conservative aggregate) Leading causes of death: Cardiovascular disease (17.9M), Cancer (10.3M), Respiratory disease (4.0M) Note: Baseline data for regulatory mortality analysis. Conservative estimate of pharmaceutical impact based on WHO immunization data (4.5M/year from vaccines) + cardiovascular interventions (3.3M/year) + oncology (1.5M/year) + other therapies. Additional sources: https://www.who.int/data/gho/data/themes/mortality-and-global-health-estimates
.
6.
GiveWell. GiveWell cost per life saved for top charities (2024).
GiveWell: Top Charities https://www.givewell.org/charities/top-charities General range: $3,000-$5,500 per life saved (GiveWell top charities) Helen Keller International (Vitamin A): $3,500 average (2022-2024); varies $1,000-$8,500 by country Against Malaria Foundation: $5,500 per life saved New Incentives (vaccination incentives): $4,500 per life saved Malaria Consortium (seasonal malaria chemoprevention): $3,500 per life saved VAS program details: $2 to provide vitamin A supplements to child for one year Note: Figures accurate for 2024. Helen Keller VAS program has wide country variation ($1K-$8.5K) but $3,500 is accurate average. Among most cost-effective interventions globally Additional sources: https://www.givewell.org/charities/top-charities | https://www.givewell.org/charities/helen-keller-international | https://ourworldindata.org/cost-effectiveness
.
7.
U.S. Department of Defense.
5.56mm NATO ammunition bulk procurement pricing. (2024)
The cost of 5.56mm NATO ammunition at military bulk procurement rates is approximately $0.40 per round, based on Lake City Army Ammunition Plant production and commercial market floor prices for mil-spec M855 ammunition.
8.
Pike, J.
U.s. Forces fire 250,000 rounds for every insurgent killed. (2011)
The General Accounting Office reports that US forces used 1.8 billion rounds of small-arms ammunition per year, a level that more than doubled in five years. An estimated 250,000 rounds were fired for every insurgent killed in Iraq and Afghanistan.
9.
AARP. Unpaid caregiver hours and economic value.
AARP 2023 https://www.aarp.org/caregiving/financial-legal/info-2023/unpaid-caregivers-provide-billions-in-care.html (2023)
Average family caregiver: 25-26 hours per week (100-104 hours per month) 38 million caregivers providing 36 billion hours of care annually Economic value: $16.59 per hour = $600 billion total annual value (2021) 28% of people provided eldercare on a given day, averaging 3.9 hours when providing care Caregivers living with care recipient: 37.4 hours per week Caregivers not living with recipient: 23.7 hours per week Note: Disease-related caregiving is subset of total; includes elderly care, disability care, and child care Additional sources: https://www.aarp.org/caregiving/financial-legal/info-2023/unpaid-caregivers-provide-billions-in-care.html | https://www.bls.gov/news.release/elcare.nr0.htm | https://www.caregiver.org/resource/caregiver-statistics-demographics/
.
11.
Forbes.
Forbes world’s billionaires list 2024. (2024)
Forbes identified a record 2,781 billionaires worldwide with combined net worth of $14.2 trillion, 141 more than 2023. Bernard Arnault (LVMH) topped the list at $233 billion.
12.
CDC MMWR. Childhood vaccination economic benefits.
CDC MMWR https://www.cdc.gov/mmwr/volumes/73/wr/mm7331a2.htm (1994)
US programs (1994-2023): $540B direct savings, $2.7T societal savings ( $18B/year direct, $90B/year societal) Global (2001-2020): $820B value for 10 diseases in 73 countries ( $41B/year) ROI: $11 return per $1 invested Measles vaccination alone saved 93.7M lives (61% of 154M total) over 50 years (1974-2024) Additional sources: https://www.cdc.gov/mmwr/volumes/73/wr/mm7331a2.htm | https://www.thelancet.com/journals/lancet/article/PIIS0140-6736(24)00850-X/fulltext
.
16.
U.S. Bureau of Labor Statistics.
CPI inflation calculator. (2024)
CPI-U (1980): 82.4 CPI-U (2024): 313.5 Inflation multiplier (1980-2024): 3.80× Cumulative inflation: 280.48% Average annual inflation rate: 3.08% Note: Official U.S. government inflation data using Consumer Price Index for All Urban Consumers (CPI-U). Additional sources: https://www.bls.gov/data/inflation_calculator.htm
.
17.
James Surowiecki.
The Wisdom of Crowds. (Surowiecki, 2004).
Explores the aggregation of information in groups, arguing that decisions are often better than could have been made by any single member of the group. The opening anecdote relates Francis Galton’s surprise that the crowd at a county fair accurately guessed the weight of an ox when the median of their individual guesses was taken. The three conditions for a group to be intelligent are diversity, independence, and decentralization. Additional sources: https://archive.org/details/wisdomofcrowds0000suro | https://en.wikipedia.org/wiki/The_Wisdom_of_Crowds | https://www.amazon.com/Wisdom-Crowds-James-Surowiecki/dp/0385721706
.
18.
ClinicalTrials.gov API v2 direct analysis. ClinicalTrials.gov cumulative enrollment data (2025).
Direct analysis via ClinicalTrials.gov API v2 https://clinicaltrials.gov/data-api/api Analysis of 100,000 active/recruiting/completed trials on ClinicalTrials.gov (as of January 2025) shows cumulative enrollment of 12.2 million participants: Phase 1 (722k), Phase 2 (2.2M), Phase 3 (6.5M), Phase 4 (2.7M). Median participants per trial: Phase 1 (33), Phase 2 (60), Phase 3 (237), Phase 4 (90). Additional sources: https://clinicaltrials.gov/data-api/api
.
19.
ACS CAN. Clinical trial patient participation rate.
ACS CAN: Barriers to Clinical Trial Enrollment https://www.fightcancer.org/policy-resources/barriers-patient-enrollment-therapeutic-clinical-trials-cancer Only 3-5% of adult cancer patients in US receive treatment within clinical trials About 5% of American adults have ever participated in any clinical trial Oncology: 2-3% of all oncology patients participate Contrast: 50-60% enrollment for pediatric cancer trials (<15 years old) Note: 20% of cancer trials fail due to insufficient enrollment; 11% of research sites enroll zero patients Additional sources: https://www.fightcancer.org/policy-resources/barriers-patient-enrollment-therapeutic-clinical-trials-cancer | https://hints.cancer.gov/docs/Briefs/HINTS_Brief_48.pdf
.
20.
ScienceDaily. Global prevalence of chronic disease.
ScienceDaily: GBD 2015 Study https://www.sciencedaily.com/releases/2015/06/150608081753.htm (2015)
2.3 billion individuals had more than five ailments (2013) Chronic conditions caused 74% of all deaths worldwide (2019), up from 67% (2010) Approximately 1 in 3 adults suffer from multiple chronic conditions (MCCs) Risk factor exposures: 2B exposed to biomass fuel, 1B to air pollution, 1B smokers Projected economic cost: $47 trillion by 2030 Note: 2.3B with 5+ ailments is more accurate than "2B with chronic disease." One-third of all adults globally have multiple chronic conditions Additional sources: https://www.sciencedaily.com/releases/2015/06/150608081753.htm | https://pmc.ncbi.nlm.nih.gov/articles/PMC10830426/ | https://pmc.ncbi.nlm.nih.gov/articles/PMC6214883/
.
21.
C&EN. Annual number of new drugs approved globally: 50.
C&EN https://cen.acs.org/pharmaceuticals/50-new-drugs-received-FDA/103/i2 (2025)
50 new drugs approved annually Additional sources: https://cen.acs.org/pharmaceuticals/50-new-drugs-received-FDA/103/i2 | https://www.fda.gov/drugs/development-approval-process-drugs/novel-drug-approvals-fda
.
22.
Williams, R. J., Tse, T., DiPiazza, K. & Zarin, D. A.
Terminated trials in the ClinicalTrials.gov results database: Evaluation of availability of primary outcome data and reasons for termination.
PLOS One 10, e0127242 (2015)
Approximately 12% of trials with results posted on the ClinicalTrials.gov results database (905/7,646) were terminated. Primary reasons: insufficient accrual (57% of non-data-driven terminations), business/strategic reasons, and efficacy/toxicity findings (21% data-driven terminations).
25.
OpenSecrets. Defense sector lobbying summary.
OpenSecrets https://www.opensecrets.org/federal-lobbying/sectors/summary?id=D (2025)
Military sector federal lobbying totaled $198,009,793 in 2025, up from $159.5 million in 2024 and $142.9 million in 2023. Additional sources: https://www.opensecrets.org/federal-lobbying/sectors/summary?id=D
.
26.
Companies Market Cap.
BAE systems and thales market capitalization. (2026)
BAE Systems market capitalization approx $75.80B and Thales approx $56.68B as of June 2026, combined approx $132.5B for the two major allied European military primes. Additional sources: https://companiesmarketcap.com/thales/marketcap/
.
27.
Stock Analysis.
Military prime contractor market capitalization and float statistics. (2026)
Combined market capitalization of 11 US military primes approx $835.8B at the 2026-06-11 close: RTX $248.07B, Boeing $174.71B, Lockheed Martin $126.51B, General Dynamics $96.90B, Northrop Grumman $78.48B, L3Harris $58.16B, Leidos $15.36B, Huntington Ingalls $11.86B, CACI $11.61B, Booz Allen Hamilton $9.24B, SAIC $4.86B. Tradeable float across the 13 Western primes (adding BAE Systems and Thales) approx $880B, about 91 percent of combined cap (range $850-900B), from per-company float and shares-outstanding statistics pages; big-5 floats verified individually (RTX 92.6%, BA 96.0%, LMT 85.7%, GD 94.2%, NOC 99.7%); Thales is the outlier at approx 45% float because the French State (26.60%) and Dassault Aviation (26.59%) stakes are locked. Additional sources: https://stockanalysis.com/stocks/rtx/statistics/ | https://www.dassault-aviation.com/en/group/about-us/shareholding-structure-and-organization-chart/
.
28.
Rummel, R. J.
Death by Government: Genocide and Mass Murder Since 1900. (Transaction Publishers, 1994).
Political scientist R.J. Rummel’s comprehensive accounting of democide (government murder of unarmed civilians) in the 20th century. His final revised estimate: 262 million people murdered by their own governments from 1900-1999, excluding battle deaths in wars. Range: 200-272+ million. Communist regimes account for the largest share (100-148+ million). Updated figures at hawaii.edu/powerkills.
29.
GiveWell. Cost per DALY for deworming programs.
https://www.givewell.org/international/technical/programs/deworming/cost-effectiveness Schistosomiasis treatment: $28.19-$70.48 per DALY (using arithmetic means with varying disability weights) Soil-transmitted helminths (STH) treatment: $82.54 per DALY (midpoint estimate) Note: GiveWell explicitly states this 2011 analysis is "out of date" and their current methodology focuses on long-term income effects rather than short-term health DALYs Additional sources: https://www.givewell.org/international/technical/programs/deworming/cost-effectiveness
.
30.
Calculated from IHME Global Burden of Disease (2.55B DALYs) and global GDP per capita valuation. $109 trillion annual global disease burden.
The global economic burden of disease, including direct healthcare costs ($8.2 trillion) and lost productivity ($100.9 trillion from 2.55 billion DALYs × $39,570 per DALY), totals approximately $109.1 trillion annually.
32.
Think by Numbers. Pre-1962 drug development costs and timeline (think by numbers).
Think by Numbers: How Many Lives Does FDA Save? https://thinkbynumbers.org/health/how-many-net-lives-does-the-fda-save/ (1962)
Historical estimates (1970-1985): USD $226M fully capitalized (2011 prices) 1980s drugs: $65M after-tax R&D (1990 dollars), $194M compounded to approval (1990 dollars) Modern comparison: $2-3B costs, 7-12 years (dramatic increase from pre-1962) Context: 1962 regulatory clampdown reduced new treatment production by 70%, dramatically increasing development timelines and costs Note: Secondary source; less reliable than Congressional testimony Additional sources: https://thinkbynumbers.org/health/how-many-net-lives-does-the-fda-save/ | https://en.wikipedia.org/wiki/Cost_of_drug_development | https://www.statnews.com/2018/10/01/changing-1962-law-slash-drug-prices/
.
33.
Biotechnology Innovation Organization (BIO). BIO clinical development success rates 2011-2020.
Biotechnology Innovation Organization (BIO) https://go.bio.org/rs/490-EHZ-999/images/ClinicalDevelopmentSuccessRates2011_2020.pdf (2021)
Phase I duration: 2.3 years average Total time to market (Phase I-III + approval): 10.5 years average Phase transition success rates: Phase I→II: 63.2%, Phase II→III: 30.7%, Phase III→Approval: 58.1% Overall probability of approval from Phase I: 12% Note: Largest publicly available study of clinical trial success rates. Efficacy lag = 10.5 - 2.3 = 8.2 years post-safety verification. Additional sources: https://go.bio.org/rs/490-EHZ-999/images/ClinicalDevelopmentSuccessRates2011_2020.pdf
.
34.
Nature Medicine. Drug repurposing rate ( 30%).
Nature Medicine https://www.nature.com/articles/s41591-024-03233-x (2024)
Approximately 30% of drugs gain at least one new indication after initial approval. Additional sources: https://www.nature.com/articles/s41591-024-03233-x
.
35.
EPI. Education investment economic multiplier (2.1).
EPI: Public Investments Outside Core Infrastructure https://www.epi.org/publication/bp348-public-investments-outside-core-infrastructure/ Early childhood education: Benefits 12X outlays by 2050; $8.70 per dollar over lifetime Educational facilities: $1 spent → $1.50 economic returns Energy efficiency comparison: 2-to-1 benefit-to-cost ratio (McKinsey) Private return to schooling: 9% per additional year (World Bank meta-analysis) Note: 2.1 multiplier aligns with benefit-to-cost ratios for educational infrastructure/energy efficiency. Early childhood education shows much higher returns (12X by 2050) Additional sources: https://www.epi.org/publication/bp348-public-investments-outside-core-infrastructure/ | https://documents1.worldbank.org/curated/en/442521523465644318/pdf/WPS8402.pdf | https://freopp.org/whitepapers/establishing-a-practical-return-on-investment-framework-for-education-and-skills-development-to-expand-economic-opportunity/
.
36.
PMC. Healthcare investment economic multiplier (1.8).
PMC: California Universal Health Care https://pmc.ncbi.nlm.nih.gov/articles/PMC5954824/ (2022)
Healthcare fiscal multiplier: 4.3 (95% CI: 2.5-6.1) during pre-recession period (1995-2007) Overall government spending multiplier: 1.61 (95% CI: 1.37-1.86) Why healthcare has high multipliers: No effect on trade deficits (spending stays domestic); improves productivity & competitiveness; enhances long-run potential output Gender-sensitive fiscal spending (health & care economy) produces substantial positive growth impacts Note: "1.8" appears to be conservative estimate; research shows healthcare multipliers of 4.3 Additional sources: https://pmc.ncbi.nlm.nih.gov/articles/PMC5954824/ | https://cepr.org/voxeu/columns/government-investment-and-fiscal-stimulus | https://ncbi.nlm.nih.gov/pmc/articles/PMC3849102/ | https://set.odi.org/wp-content/uploads/2022/01/Fiscal-multipliers-review.pdf
.
37.
World Bank. Infrastructure investment economic multiplier (1.6).
World Bank: Infrastructure Investment as Stimulus https://blogs.worldbank.org/en/ppps/effectiveness-infrastructure-investment-fiscal-stimulus-what-weve-learned (2022)
Infrastructure fiscal multiplier: 1.6 during contractionary phase of economic cycle Average across all economic states: 1.5 (meaning $1 of public investment → $1.50 of economic activity) Time horizon: 0.8 within 1 year, 1.5 within 2-5 years Range of estimates: 1.5-2.0 (following 2008 financial crisis & American Recovery Act) Italian public construction: 1.5-1.9 multiplier US ARRA: 0.4-2.2 range (differential impacts by program type) Economic Policy Institute: Uses 1.6 for infrastructure spending (middle range of estimates) Note: Public investment less likely to crowd out private activity during recessions; particularly effective when monetary policy loose with near-zero rates Additional sources: https://blogs.worldbank.org/en/ppps/effectiveness-infrastructure-investment-fiscal-stimulus-what-weve-learned | https://www.gihub.org/infrastructure-monitor/insights/fiscal-multiplier-effect-of-infrastructure-investment/ | https://cepr.org/voxeu/columns/government-investment-and-fiscal-stimulus | https://www.richmondfed.org/publications/research/economic_brief/2022/eb_22-04
.
38.
Mercatus. Military spending economic multiplier (0.6).
Mercatus: Defense Spending and Economy https://www.mercatus.org/research/research-papers/defense-spending-and-economy Ramey (2011): 0.6 short-run multiplier Barro (1981): 0.6 multiplier for WWII spending (war spending crowded out 40¢ private economic activity per federal dollar) Barro & Redlick (2011): 0.4 within current year, 0.6 over two years; increased govt spending reduces private-sector GDP portions General finding: $1 increase in deficit-financed federal military spending = less than $1 increase in GDP Variation by context: Central/Eastern European NATO: 0.6 on impact, 1.5-1.6 in years 2-3, gradual fall to zero Ramey & Zubairy (2018): Cumulative 1% GDP increase in military expenditure raises GDP by 0.7% Additional sources: https://www.mercatus.org/research/research-papers/defense-spending-and-economy | https://cepr.org/voxeu/columns/world-war-ii-america-spending-deficits-multipliers-and-sacrifice | https://www.rand.org/content/dam/rand/pubs/research_reports/RRA700/RRA739-2/RAND_RRA739-2.pdf
.
40.
FDA. FDA-approved prescription drug products (20,000+).
FDA https://www.fda.gov/media/143704/download There are over 20,000 prescription drug products approved for marketing. Additional sources: https://www.fda.gov/media/143704/download
.
43.
ACLED. Active combat deaths annually.
ACLED: Global Conflict Surged 2024 https://acleddata.com/2024/12/12/data-shows-global-conflict-surged-in-2024-the-washington-post/ (2024)
2024: 233,597 deaths (30% increase from 179,099 in 2023) Deadliest conflicts: Ukraine (67,000), Palestine (35,000) Nearly 200,000 acts of violence (25% higher than 2023, double from 5 years ago) One in six people globally live in conflict-affected areas Additional sources: https://acleddata.com/2024/12/12/data-shows-global-conflict-surged-in-2024-the-washington-post/ | https://acleddata.com/media-citation/data-shows-global-conflict-surged-2024-washington-post | https://acleddata.com/conflict-index/index-january-2024/
.
44.
UCDP. State violence deaths annually.
UCDP: Uppsala Conflict Data Program https://ucdp.uu.se/ Uppsala Conflict Data Program (UCDP): Tracks one-sided violence (organized actors attacking unarmed civilians) UCDP definition: Conflicts causing at least 25 battle-related deaths in calendar year 2023 total organized violence: 154,000 deaths; Non-state conflicts: 20,900 deaths UCDP collects data on state-based conflicts, non-state conflicts, and one-sided violence Specific "2,700 annually" figure for state violence not found in recent UCDP data; actual figures vary annually Additional sources: https://ucdp.uu.se/ | https://en.wikipedia.org/wiki/Uppsala_Conflict_Data_Program | https://ourworldindata.org/grapher/deaths-in-armed-conflicts-by-region
.
45.
Our World in Data. Terror attack deaths (8,300 annually).
Our World in Data: Terrorism https://ourworldindata.org/terrorism (2024)
2023: 8,352 deaths (22% increase from 2022, highest since 2017) 2023: 3,350 terrorist incidents (22% decrease), but 56% increase in avg deaths per attack Global Terrorism Database (GTD): 200,000+ terrorist attacks recorded (2021 version) Maintained by: National Consortium for Study of Terrorism & Responses to Terrorism (START), U. of Maryland Geographic shift: Epicenter moved from Middle East to Central Sahel (sub-Saharan Africa) - now >50% of all deaths Additional sources: https://ourworldindata.org/terrorism | https://reliefweb.int/report/world/global-terrorism-index-2024 | https://www.start.umd.edu/gtd/ | https://ourworldindata.org/grapher/fatalities-from-terrorism
.
46.
Institute for Health Metrics and Evaluation (IHME). IHME global burden of disease 2021 (2.88B DALYs, 1.13B YLD).
Institute for Health Metrics and Evaluation (IHME) https://vizhub.healthdata.org/gbd-results/ (2024)
In 2021, global DALYs totaled approximately 2.88 billion, comprising 1.75 billion Years of Life Lost (YLL) and 1.13 billion Years Lived with Disability (YLD). This represents a 13% increase from 2019 (2.55B DALYs), largely attributable to COVID-19 deaths and aging populations. YLD accounts for approximately 39% of total DALYs, reflecting the substantial burden of non-fatal chronic conditions. Additional sources: https://vizhub.healthdata.org/gbd-results/ | https://www.thelancet.com/journals/lancet/article/PIIS0140-6736(24)00757-8/fulltext | https://www.healthdata.org/research-analysis/about-gbd
.
47.
Costs of War Project, Brown University Watson Institute. Environmental cost of war ($100B annually).
Brown Watson Costs of War: Environmental Cost https://watson.brown.edu/costsofwar/costs/social/environment War on Terror emissions: 1.2B metric tons GHG (equivalent to 257M cars/year) Military: 5.5% of global GHG emissions (2X aviation + shipping combined) US DoD: World’s single largest institutional oil consumer, 47th largest emitter if nation Cleanup costs: $500B+ for military contaminated sites Gaza war environmental damage: $56.4B; landmine clearance: $34.6B expected Climate finance gap: Rich nations spend 30X more on military than climate finance Note: Military activities cause massive environmental damage through GHG emissions, toxic contamination, and long-term cleanup costs far exceeding current climate finance commitments Additional sources: https://watson.brown.edu/costsofwar/costs/social/environment | https://earth.org/environmental-costs-of-wars/ | https://transformdefence.org/transformdefence/stats/
.
48.
ScienceDaily. Medical research lives saved annually (4.2 million).
ScienceDaily: Physical Activity Prevents 4M Deaths https://www.sciencedaily.com/releases/2020/06/200617194510.htm (2020)
Physical activity: 3.9M early deaths averted annually worldwide (15% lower premature deaths than without) COVID vaccines (2020-2024): 2.533M deaths averted, 14.8M life-years preserved; first year alone: 14.4M deaths prevented Cardiovascular prevention: 3 interventions could delay 94.3M deaths over 25 years (antihypertensives alone: 39.4M) Pandemic research response: Millions of deaths averted through rapid vaccine/drug development Additional sources: https://www.sciencedaily.com/releases/2020/06/200617194510.htm | https://pmc.ncbi.nlm.nih.gov/articles/PMC9537923/ | https://www.ahajournals.org/doi/10.1161/CIRCULATIONAHA.118.038160 | https://pmc.ncbi.nlm.nih.gov/articles/PMC9464102/
.
49.
SIPRI. 36:1 disparity ratio of spending on weapons over cures.
SIPRI: Military Spending https://www.sipri.org/commentary/blog/2016/opportunity-cost-world-military-spending (2016)
Global military spending: $2.7 trillion (2024, SIPRI) Global government medical research: $68 billion (2024) Actual ratio: 39.7:1 in favor of weapons over medical research Military R&D alone: $85B (2004 data, 10% of global R&D) Military spending increases crowd out health: 1% ↑ military = 0.62% ↓ health spending Note: Ratio actually worse than 36:1. Each 1% increase in military spending reduces health spending by 0.62%, with effect more intense in poorer countries (0.962% reduction) Additional sources: https://www.sipri.org/commentary/blog/2016/opportunity-cost-world-military-spending | https://pmc.ncbi.nlm.nih.gov/articles/PMC9174441/ | https://www.congress.gov/crs-product/R45403
.
50.
Think by Numbers. Lost human capital due to war ($270B annually).
Think by Numbers https://thinkbynumbers.org/military/war/the-economic-case-for-peace-a-comprehensive-financial-analysis/ (2021)
Lost human capital from war: $300B annually (economic impact of losing skilled/productive individuals to conflict) Broader conflict/violence cost: $14T/year globally 1.4M violent deaths/year; conflict holds back economic development, causes instability, widens inequality, erodes human capital 2002: 48.4M DALYs lost from 1.6M violence deaths = $151B economic value (2000 USD) Economic toll includes: commodity prices, inflation, supply chain disruption, declining output, lost human capital Additional sources: https://thinkbynumbers.org/military/war/the-economic-case-for-peace-a-comprehensive-financial-analysis/ | https://www.weforum.org/stories/2021/02/war-violence-costs-each-human-5-a-day/ | https://pubmed.ncbi.nlm.nih.gov/19115548/
.
51.
PubMed. Psychological impact of war cost ($100B annually).
PubMed: Economic Burden of PTSD https://pubmed.ncbi.nlm.nih.gov/35485933/ PTSD economic burden (2018 U.S.): $232.2B total ($189.5B civilian, $42.7B military) Civilian costs driven by: Direct healthcare ($66B), unemployment ($42.7B) Military costs driven by: Disability ($17.8B), direct healthcare ($10.1B) Exceeds costs of other mental health conditions (anxiety, depression) War-exposed populations: 2-3X higher rates of anxiety, depression, PTSD; women and children most vulnerable Note: Actual burden $232B, significantly higher than "$100B" claimed Additional sources: https://pubmed.ncbi.nlm.nih.gov/35485933/ | https://news.va.gov/103611/study-national-economic-burden-of-ptsd-staggering/ | https://pmc.ncbi.nlm.nih.gov/articles/PMC9957523/
.
52.
CGDev. UNHCR average refugee support cost.
CGDev https://www.cgdev.org/blog/costs-hosting-refugees-oecd-countries-and-why-uk-outlier (2024)
The average cost of supporting a refugee is $1,384 per year. This represents total host country costs (housing, healthcare, education, security). OECD countries average $6,100 per refugee (mean 2022-2023), with developing countries spending $700-1,000. Global weighted average of $1,384 is reasonable given that 75-85% of refugees are in low/middle-income countries. Additional sources: https://www.cgdev.org/blog/costs-hosting-refugees-oecd-countries-and-why-uk-outlier | https://www.unhcr.org/sites/default/files/2024-11/UNHCR-WB-global-cost-of-refugee-inclusion-in-host-country-health-systems.pdf
.
53.
World Bank. World bank trade disruption cost from conflict.
World Bank https://www.worldbank.org/en/topic/trade/publication/trading-away-from-conflict Estimated $616B annual cost from conflict-related trade disruption. World Bank research shows civil war costs an average developing country 30 years of GDP growth, with 20 years needed for trade to return to pre-war levels. Trade disputes analysis shows tariff escalation could reduce global exports by up to $674 billion. Additional sources: https://www.worldbank.org/en/topic/trade/publication/trading-away-from-conflict | https://www.nber.org/papers/w11565 | http://blogs.worldbank.org/en/trade/impacts-global-trade-and-income-current-trade-disputes
.
54.
VA. Veteran healthcare cost projections.
VA https://department.va.gov/wp-content/uploads/2025/06/2026-Budget-in-Brief.pdf (2026)
VA budget: $441.3B requested for FY 2026 (10% increase). Disability compensation: $165.6B in FY 2024 for 6.7M veterans. PACT Act projected to increase spending by $300B between 2022-2031. Costs under Toxic Exposures Fund: $20B (2024), $30.4B (2025), $52.6B (2026). Additional sources: https://department.va.gov/wp-content/uploads/2025/06/2026-Budget-in-Brief.pdf | https://www.cbo.gov/publication/45615 | https://www.legion.org/information-center/news/veterans-healthcare/2025/june/va-budget-tops-400-billion-for-2025-from-higher-spending-on-mandated-benefits-medical-care
.
57.
Cybersecurity Ventures. Cybercrime economy projected to reach $10.5 trillion.
Cybersecurity Ventures: $10.5T Cybercrime https://cybersecurityventures.com/hackerpocalypse-cybercrime-report-2016/ (2016)
Global cybercrime costs: $3T (2015) → $6T (2021) → $10.5T (2025 projected) 15% annual growth rate If measured as country, would be 3rd largest economy after US and China Greatest transfer of economic wealth in history Note: More profitable than global trade of all major illegal drugs combined. Includes data theft, productivity loss, IP theft, fraud Additional sources: <https://cybersecurityventures.com/hackerpocalypse-cybercrime-report-2016/> | https://www.boisestate.edu/cybersecurity/2022/06/16/cybercrime-to-cost-the-world-10-5-trillion-annually-by-2025/
.
59.
Bolt, J. & Zanden, J. L. van.
Maddison project database 2020. (2020)
Historical GDP per capita estimates from year 1 to present. Global GDP per capita in 1900: approximately 1,260 in 1990 international dollars (roughly 3,150 in 2024 USD after PPP and inflation adjustment). Standard reference for long-run comparative economic history.
60.
Applied Clinical Trials. Global government spending on interventional clinical trials: $3-6 billion/year.
Applied Clinical Trials https://www.appliedclinicaltrialsonline.com/view/sizing-clinical-research-market Estimated range based on NIH ( $0.8-5.6B), NIHR ($1.6B total budget), and EU funding ( $1.3B/year). Roughly 5-10% of global market. Additional sources: https://www.appliedclinicaltrialsonline.com/view/sizing-clinical-research-market | https://www.thelancet.com/journals/langlo/article/PIIS2214-109X(20)30357-0/fulltext
.
65.
United Nations Department of Economic and Social Affairs, Population Division.
World population prospects 2024: Summary of results. (2024)
The 2024 Revision of the World Population Prospects provides population estimates and projections for 237 countries or areas. Global median age approximately 30.5 years in 2024, reflecting population-weighted average across all regions.
68.
Estimated from major foundation budgets and activities. Nonprofit clinical trial funding estimate.
Nonprofit foundations spend an estimated $2-5 billion annually on clinical trials globally, representing approximately 2-5% of total clinical trial spending.
69.
ICAN. Global nuclear weapon maintenance cost: $100 billion/year.
ICAN: Global Spending $100B 2024 https://www.icanw.org/global_spending_on_nuclear_weapons_topped_100_billion_in_2024 (2024)
2024: >$100 billion ($190,151/minute) - 11% increase ($9.9B) from 2023 Nine nuclear-armed states: China, France, India, Israel, N. Korea, Pakistan, Russia, UK, US US: $56.8B (more than all other 8 states combined); China: $12.5B; UK: $10B (+26% YoY, biggest increase) Historical trend: $72.9B (2019) → $82.4B (2021) → >$100B (2024) Private sector contracts: $463B ongoing; $42.5B earned from contracts in 2024 alone Note: $100B/year figure accurate for 2024. Rapid growth from $73B (2019). US spends more than rest of world combined on nuclear weapons Additional sources: https://www.icanw.org/global_spending_on_nuclear_weapons_topped_100_billion_in_2024 | https://www.icanw.org/the_cost_of_nuclear_weapons
.
70.
Industry reports: IQVIA. Global pharmaceutical r&d spending.
Total global pharmaceutical R&D spending is approximately $300 billion annually. Clinical trials represent 15-20% of this total ($45-60B), with the remainder going to drug discovery, preclinical research, regulatory affairs, and manufacturing development.
71.
UN. Global population reaches 8 billion.
UN: World Population 8 Billion Nov 15 2022 https://www.un.org/en/desa/world-population-reach-8-billion-15-november-2022 (2022)
Milestone: November 15, 2022 (UN World Population Prospects 2022) Day of Eight Billion" designated by UN Added 1 billion people in just 11 years (2011-2022) Growth rate: Slowest since 1950; fell under 1% in 2020 Future: 15 years to reach 9B (2037); projected peak 10.4B in 2080s Projections: 8.5B (2030), 9.7B (2050), 10.4B (2080-2100 plateau) Note: Milestone reached Nov 2022. Population growth slowing; will take longer to add next billion (15 years vs 11 years) Additional sources: https://www.un.org/en/desa/world-population-reach-8-billion-15-november-2022 | https://www.un.org/en/dayof8billion | https://en.wikipedia.org/wiki/Day_of_Eight_Billion
.
72.
Harvard Kennedy School. 3.5% participation tipping point.
Harvard Kennedy School https://www.hks.harvard.edu/centers/carr/publications/35-rule-how-small-minority-can-change-world (2020)
The research found that nonviolent campaigns were twice as likely to succeed as violent ones, and once 3.5% of the population were involved, they were always successful. Chenoweth and Maria Stephan studied the success rates of civil resistance efforts from 1900 to 2006, finding that nonviolent movements attracted, on average, four times as many participants as violent movements and were more likely to succeed. Key finding: Every campaign that mobilized at least 3.5% of the population in sustained protest was successful (in their 1900-2006 dataset) Note: The 3.5% figure is a descriptive statistic from historical analysis, not a guaranteed threshold. One exception (Bahrain 2011-2014 with 6%+ participation) has been identified. The rule applies to regime change, not policy change in democracies. Additional sources: https://www.hks.harvard.edu/centers/carr/publications/35-rule-how-small-minority-can-change-world | https://www.hks.harvard.edu/sites/default/files/2024-05/Erica%20Chenoweth_2020-005.pdf | https://www.bbc.com/future/article/20190513-it-only-takes-35-of-people-to-change-the-world | https://en.wikipedia.org/wiki/3.5%25_rule
.
73.
International IDEA.
International IDEA voter turnout database world export. (2026)
Best current register-based estimate of global registered voters. Sum of the latest available country-level Registration counts in International IDEA’s world export on 2026-04-22 = 4,128,142,495 registered voters across 199 countries and political entities. Methodology notes that Registration is the number of names on the voters’ register as reported by electoral management bodies, and comparability is imperfect because voter rolls and registration systems differ across countries. Additional sources: https://www.idea.int/data-tools/data/voter-turnout-database | https://www.idea.int/data-tools/export?type=region_only&themeId=293&world=all&loc=home
.
75.
Federation of American Scientists. World nuclear forces.
Federation of American Scientists https://fas.org/issues/nuclear-weapons/status-world-nuclear-forces/ (2024)
As of early 2025, we estimate that the world’s nine nuclear-armed states possess a combined total of approximately 12,241 nuclear warheads. Additional sources: https://fas.org/issues/nuclear-weapons/status-world-nuclear-forces/
.
76.
OpenSecrets.
Top lobbying industries 2025. (2025)
Sector ranks and per-company federal lobbying spending for 2025. Combined market capitalization of the top-5 publicly traded US lobbying spenders in each government-controlling sector: pharmaceuticals $1,794.7B; technology $13,279.5B; insurance $385.6B; oil and gas $1,246.9B; four-sector total approx $16.71T. Caveats: Meta (Zuckerberg holds 60.8% of voting power) and Alphabet (Page and Brin hold 52.3%) cannot be majority-acquired; Ellison owns 40.6% of Oracle; the largest insurance lobbyists are mutuals with no public shares; trade associations (PhRMA, AHIP, SIFMA, API) are not acquirable. Additional sources: https://stockanalysis.com/stocks/
.
77.
NHGRI. Human genome project and CRISPR discovery.
NHGRI https://www.genome.gov/11006929/2003-release-international-consortium-completes-hgp (2003)
Your DNA is 3 billion base pairs Read the entire code (Human Genome Project, completed 2003) Learned to edit it (CRISPR, discovered 2012) Additional sources: https://www.genome.gov/11006929/2003-release-international-consortium-completes-hgp | https://www.nobelprize.org/prizes/chemistry/2020/press-release/
.
78.
PMC. Only 12% of human interactome targeted.
PMC https://pmc.ncbi.nlm.nih.gov/articles/PMC10749231/ (2023)
Mapping 350,000+ clinical trials showed that only 12% of the human interactome has ever been targeted by drugs. Additional sources: https://pmc.ncbi.nlm.nih.gov/articles/PMC10749231/
.
79.
WHO. ICD-10 code count ( 14,000).
WHO https://icd.who.int/browse10/2019/en (2019)
The ICD-10 classification contains approximately 14,000 codes for diseases, signs and symptoms. Additional sources: https://icd.who.int/browse10/2019/en
.
81.
McFarland, M. J., Hauer, M. E. & Reuben, A.
Half of US population exposed to adverse lead levels in early childhood.
Proceedings of the National Academy of Sciences 119, e2118631119 (2022)
Leaded gasoline, used in the US from 1923 until its on-road ban in 1996, exposed more than half of the 2015 US population to adverse blood-lead levels in early childhood. The authors estimate childhood lead exposure cost the population a cumulative 824 million IQ points, an average of 2.6 points per person, rising to 5.9 points for the most-exposed 1966-1970 birth cohort.
82.
Wikipedia. Longevity escape velocity (LEV) - maximum human life extension potential.
Wikipedia: Longevity Escape Velocity https://en.wikipedia.org/wiki/Longevity_escape_velocity Longevity escape velocity: Hypothetical point where medical advances extend life expectancy faster than time passes Term coined by Aubrey de Grey (biogerontologist) in 2004 paper; concept from David Gobel (Methuselah Foundation) Current progress: Science adds 3 months to lifespan per year; LEV requires adding >1 year per year Sinclair (Harvard): "There is no biological upper limit to age" - first person to live to 150 may already be born De Grey: 50% chance of reaching LEV by mid-to-late 2030s; SENS approach = damage repair rather than slowing damage Kurzweil (2024): LEV by 2029-2035, AI will simulate biological processes to accelerate solutions George Church: LEV "in a decade or two" via age-reversal clinical trials Natural lifespan cap: 120-150 years (Jeanne Calment record: 122); engineering approach could bypass via damage repair Key mechanisms: Epigenetic reprogramming, senolytic drugs, stem cell therapy, gene therapy, AI-driven drug discovery Current record: Jeanne Calment (122 years, 164 days) - record unbroken since 1997 Note: LEV is theoretical but increasingly plausible given demonstrated age reversal in mice (109% lifespan extension) and human cells (30-year epigenetic age reversal) Additional sources: https://en.wikipedia.org/wiki/Longevity_escape_velocity | https://pmc.ncbi.nlm.nih.gov/articles/PMC423155/ | https://www.popularmechanics.com/science/a36712084/can-science-cure-death-longevity/ | https://www.diamandis.com/blog/longevity-escape-velocity
.
83.
OpenSecrets. Lobbyist statistics for washington d.c.
OpenSecrets: Lobbying in US https://en.wikipedia.org/wiki/Lobbying_in_the_United_States Registered lobbyists: Over 12,000 (some estimates); 12,281 registered (2013) Former government employees as lobbyists: 2,200+ former federal employees (1998-2004), including 273 former White House staffers, 250 former Congress members & agency heads Congressional revolving door: 43% (86 of 198) lawmakers who left 1998-2004 became lobbyists; currently 59% leaving to private sector work for lobbying/consulting firms/trade groups Executive branch: 8% were registered lobbyists at some point before/after government service Additional sources: https://en.wikipedia.org/wiki/Lobbying_in_the_United_States | https://www.opensecrets.org/revolving-door | https://www.citizen.org/article/revolving-congress/ | https://www.propublica.org/article/we-found-a-staggering-281-lobbyists-whove-worked-in-the-trump-administration
.
84.
MDPI Vaccines. Measles vaccination ROI.
MDPI Vaccines https://www.mdpi.com/2076-393X/12/11/1210 (2024)
Single measles vaccination: 167:1 benefit-cost ratio. MMR (measles-mumps-rubella) vaccination: 14:1 ROI. Historical US elimination efforts (1966-1974): benefit-cost ratio of 10.3:1 with net benefits exceeding USD 1.1 billion (1972 dollars, or USD 8.0 billion in 2023 dollars). 2-dose MMR programs show direct benefit/cost ratio of 14.2 with net savings of $5.3 billion, and 26.0 from societal perspectives with net savings of $11.6 billion. Additional sources: https://www.mdpi.com/2076-393X/12/11/1210 | https://www.tandfonline.com/doi/full/10.1080/14760584.2024.2367451
.
88.
U.S. Government Accountability Office.
Electronic Health Records: First Year of CMS’s Incentive Programs Shows Opportunities to Improve Processes to Verify Providers Met Requirements.
https://www.gao.gov/products/gao-12-481 (2012).
94.
Calculated from Orphanet Journal of Rare Diseases (2024). Diseases getting first effective treatment each year.
Calculated from Orphanet Journal of Rare Diseases (2024) https://ojrd.biomedcentral.com/articles/10.1186/s13023-024-03398-1 (2024)
Under the current system, approximately 10-15 diseases per year receive their FIRST effective treatment. Calculation: 5% of 7,000 rare diseases ( 350) have FDA-approved treatment, accumulated over 40 years of the Orphan Drug Act = 9 rare diseases/year. Adding 5-10 non-rare diseases that get first treatments yields 10-20 total. FDA approves 50 drugs/year, but many are for diseases that already have treatments (me-too drugs, second-line therapies). Only 15 represent truly FIRST treatments for previously untreatable conditions.
95.
NIH. NIH budget (FY 2025).
NIH https://www.nih.gov/about-nih/organization/budget (2024)
The budget total of $47.7 billion also includes $1.412 billion derived from PHS Evaluation financing... Additional sources: https://www.nih.gov/about-nih/organization/budget | https://officeofbudget.od.nih.gov/
.
96.
Bentley et al. NIH spending on clinical trials: 3.3%.
Bentley et al. https://pmc.ncbi.nlm.nih.gov/articles/PMC10349341/ (2023)
NIH spent $8.1 billion on clinical trials for approved drugs (2010-2019), representing 3.3% of relevant NIH spending. Additional sources: https://pmc.ncbi.nlm.nih.gov/articles/PMC10349341/ | https://catalyst.harvard.edu/news/article/nih-spent-8-1b-for-phased-clinical-trials-of-drugs-approved-2010-19-10-of-reported-industry-spending/
.
97.
PMC. Standard medical research ROI ($20k-$100k/QALY).
PMC: Cost-effectiveness Thresholds Used by Study Authors https://pmc.ncbi.nlm.nih.gov/articles/PMC10114019/ (1990)
Typical cost-effectiveness thresholds for medical interventions in rich countries range from $50,000 to $150,000 per QALY. The Institute for Clinical and Economic Review (ICER) uses a $100,000-$150,000/QALY threshold for value-based pricing. Between 1990-2021, authors increasingly cited $100,000 (47% by 2020-21) or $150,000 (24% by 2020-21) per QALY as benchmarks for cost-effectiveness. Additional sources: https://pmc.ncbi.nlm.nih.gov/articles/PMC10114019/ | https://icer.org/our-approach/methods-process/cost-effectiveness-the-qaly-and-the-evlyg/
.
98.
Xia et al., Nature Food. Nuclear winter famine.
Xia et al. https://www.nature.com/articles/s43016-022-00573-0 (2022)
We estimate that a nuclear war between the United States and Russia would produce 150 Tg of soot and lead to 5 billion people dying at the end of year 2. Additional sources: https://www.nature.com/articles/s43016-022-00573-0
.
99.
Manhattan Institute. RECOVERY trial 82× cost reduction.
Manhattan Institute: Slow Costly Trials https://manhattan.institute/article/slow-costly-clinical-trials-drag-down-biomedical-breakthroughs RECOVERY trial: $500 per patient ($20M for 48,000 patients = $417/patient) Typical clinical trial: $41,000 median per-patient cost Cost reduction: 80-82× cheaper ($41,000 ÷ $500 ≈ 82×) Efficiency: $50 per patient per answer (10 therapeutics tested, 4 effective) Dexamethasone estimated to save >630,000 lives Additional sources: https://manhattan.institute/article/slow-costly-clinical-trials-drag-down-biomedical-breakthroughs | https://pmc.ncbi.nlm.nih.gov/articles/PMC9293394/
.
100.
Trials. Patient willingness to participate in clinical trials.
Trials: Patients’ Willingness Survey https://trialsjournal.biomedcentral.com/articles/10.1186/s13063-015-1105-3 Recent surveys: 49-51% willingness (2020-2022) - dramatic drop from 85% (2019) during COVID-19 pandemic Cancer patients when approached: 88% consented to trials (Royal Marsden Hospital) Study type variation: 44.8% willing for drug trial, 76.2% for diagnostic study Top motivation: "Learning more about my health/medical condition" (67.4%) Top barrier: "Worry about experiencing side effects" (52.6%) Additional sources: https://trialsjournal.biomedcentral.com/articles/10.1186/s13063-015-1105-3 | https://www.appliedclinicaltrialsonline.com/view/industry-forced-to-rethink-patient-participation-in-trials | https://pmc.ncbi.nlm.nih.gov/articles/PMC7183682/
.
101.
The Commune. Pentagon audit failures ($2.46T unaccounted).
The Commune https://thecommunemag.com/the-pentagon-misplaced-2-46-trillion-an-in-depth-look-at-the-financial-audit-failures (2024)
In the most recent audit, the Department of Defense (DoD) could not account for approximately 60% of its \(4.1 trillion in assets, amounting to\)2.46 trillion unaccounted for. Alternative title: Pentagon unsupported accounting adjustments (\(6.5T, single year, US Army) In 2015, the Department of Defense's Inspector General reported that the Army could not adequately support\)6.5 trillion in year-end adjustments, indicating severe accounting discrepancies. Additional sources: https://thecommunemag.com/the-pentagon-misplaced-2-46-trillion-an-in-depth-look-at-the-financial-audit-failures | https://accmag.com/audit-pentagon-cannot-account-for-6-5-trillion-dollars-is-taxpayer-money/
.
102.
Tufts CSDD. Cost of drug development.
Various estimates suggest $1.0 - $2.5 billion to bring a new drug from discovery through FDA approval, spread across 10 years. Tufts Center for the Study of Drug Development often cited for $1.0 - $2.6 billion/drug. Industry reports (IQVIA, Deloitte) also highlight $2+ billion figures.
103.
Value in Health. Average lifetime revenue per successful drug.
Value in Health: Sales Revenues for New Therapeutic Agents https://www.sciencedirect.com/science/article/pii/S1098301524027542 Study of 361 FDA-approved drugs from 1995-2014 (median follow-up 13.2 years): Mean lifetime revenue: $15.2 billion per drug Median lifetime revenue: $6.7 billion per drug Revenue after 5 years: $3.2 billion (mean) Revenue after 10 years: $9.5 billion (mean) Revenue after 15 years: $19.2 billion (mean) Distribution highly skewed: top 25 drugs (7%) accounted for 38% of total revenue ($2.1T of $5.5T) Additional sources: https://www.sciencedirect.com/science/article/pii/S1098301524027542
.
104.
Lichtenberg, F. R.
How many life-years have new drugs saved? A three-way fixed-effects analysis of 66 diseases in 27 countries, 2000-2013.
International Health 11, 403–416 (2019)
Using 3-way fixed-effects methodology (disease-country-year) across 66 diseases in 22 countries, this study estimates that drugs launched after 1981 saved 148.7 million life-years in 2013 alone. The regression coefficients for drug launches 0-11 years prior (beta=-0.031, SE=0.008) and 12+ years prior (beta=-0.057, SE=0.013) on years of life lost are highly significant (p<0.0001). Confidence interval for life-years saved: 79.4M-239.8M (95 percent CI) based on propagated standard errors from Table 2.
105.
Deloitte. Pharmaceutical r&d return on investment (ROI).
Deloitte: Measuring Pharmaceutical Innovation 2025 https://www.deloitte.com/ch/en/Industries/life-sciences-health-care/research/measuring-return-from-pharmaceutical-innovation.html (2025)
Deloitte’s annual study of top 20 pharma companies by R&D spend (2010-2024): 2024 ROI: 5.9% (second year of growth after decade of decline) 2023 ROI: 4.3% (estimated from trend) 2022 ROI: 1.2% (historic low since study began, 13-year low) 2021 ROI: 6.8% (record high, inflated by COVID-19 vaccines/treatments) Long-term trend: Declining for over a decade before 2023 recovery Average R&D cost per asset: $2.3B (2022), $2.23B (2024) These returns (1.2-5.9% range) fall far below typical corporate ROI targets (15-20%) Additional sources: https://www.deloitte.com/ch/en/Industries/life-sciences-health-care/research/measuring-return-from-pharmaceutical-innovation.html | https://www.prnewswire.com/news-releases/deloittes-13th-annual-pharmaceutical-innovation-report-pharma-rd-return-on-investment-falls-in-post-pandemic-market-301738807.html | https://hitconsultant.net/2023/02/16/pharma-rd-roi-falls-to-lowest-level-in-13-years/
.
106.
Nature Reviews Drug Discovery. Drug trial success rate from phase i to approval.
Nature Reviews Drug Discovery: Clinical Success Rates https://www.nature.com/articles/nrd.2016.136 (2016)
Overall Phase I to approval: 10-12.8% (conventional wisdom 10%, studies show 12.8%) Recent decline: Average LOA now 6.7% for Phase I (2014-2023 data) Leading pharma companies: 14.3% average LOA (range 8-23%) Varies by therapeutic area: Oncology 3.4%, CNS/cardiovascular lowest at Phase III Phase-specific success: Phase I 47-54%, Phase II 28-34%, Phase III 55-70% Note: 12% figure accurate for historical average. Recent data shows decline to 6.7%, with Phase II as primary attrition point (28% success) Additional sources: https://www.nature.com/articles/nrd.2016.136 | https://pmc.ncbi.nlm.nih.gov/articles/PMC6409418/ | https://academic.oup.com/biostatistics/article/20/2/273/4817524
.
107.
SofproMed. Phase 3 cost per trial range.
SofproMed https://www.sofpromed.com/how-much-does-a-clinical-trial-cost Phase 3 clinical trials cost between $20 million and $282 million per trial, with significant variation by therapeutic area and trial complexity. Additional sources: https://www.sofpromed.com/how-much-does-a-clinical-trial-cost | https://www.cbo.gov/publication/57126
.
108.
Ramsberg, J. & Platt, R. Pragmatic trial cost per patient (median $97).
Learning Health Systems https://pmc.ncbi.nlm.nih.gov/articles/PMC6508852/ (2018)
Meta-analysis of 108 embedded pragmatic clinical trials (2006-2016). The median cost per patient was $97 (IQR $19–$478), based on 2015 dollars. 25% of trials cost <$19/patient; 10 trials exceeded $1,000/patient. U.S. studies median $187 vs non-U.S. median $27. Additional sources: https://pmc.ncbi.nlm.nih.gov/articles/PMC6508852/
.
109.
WHO. Polio vaccination ROI.
WHO https://www.who.int/news-room/feature-stories/detail/sustaining-polio-investments-offers-a-high-return (2019)
For every dollar spent, the return on investment is nearly US$ 39." Total investment cost of US$ 7.5 billion generates projected economic and social benefits of US$ 289.2 billion from sustaining polio assets and integrating them into expanded immunization, surveillance and emergency response programmes across 8 priority countries (Afghanistan, Iraq, Libya, Pakistan, Somalia, Sudan, Syria, Yemen). Additional sources: https://www.who.int/news-room/feature-stories/detail/sustaining-polio-investments-offers-a-high-return
.
110.
ICRC. International campaign to ban landmines (ICBL) - ottawa treaty (1997).
ICRC https://www.icrc.org/en/doc/resources/documents/article/other/57jpjn.htm (1997)
ICBL: Founded 1992 by 6 NGOs (Handicap International, Human Rights Watch, Medico International, Mines Advisory Group, Physicians for Human Rights, Vietnam Veterans of America Foundation) Started with ONE staff member: Jody Williams as founding coordinator Grew to 1,000+ organizations in 60 countries by 1997 Ottawa Process: 14 months (October 1996 - December 1997) Convention signed by 122 states on December 3, 1997; entered into force March 1, 1999 Achievement: Nobel Peace Prize 1997 (shared by ICBL and Jody Williams) Government funding context: Canada established $100M CAD Canadian Landmine Fund over 10 years (1997); International donors provided $169M in 1997 for mine action (up from $100M in 1996) Additional sources: https://www.icrc.org/en/doc/resources/documents/article/other/57jpjn.htm | https://en.wikipedia.org/wiki/International_Campaign_to_Ban_Landmines | https://www.nobelprize.org/prizes/peace/1997/summary/ | https://un.org/press/en/1999/19990520.MINES.BRF.html | https://www.the-monitor.org/en-gb/reports/2003/landmine-monitor-2003/mine-action-funding.aspx
.
111.
OpenSecrets.
Revolving door: Former members of congress. (2024)
388 former members of Congress are registered as lobbyists. Nearly 5,400 former congressional staffers have left Capitol Hill to become federal lobbyists in the past 10 years. Additional sources: https://www.opensecrets.org/revolving-door
.
112.
Kinch, M. S. & Griesenauer, R. H.
Lost medicines: A longer view of the pharmaceutical industry with the potential to reinvigorate discovery.
Drug Discovery Today 24, 875–880 (2019)
Research identified 1,600+ medicines available in 1962. The 1950s represented industry high-water mark with >30 new products in five of ten years; this rate would not be replicated until late 1990s. More than half (880) of these medicines were lost following implementation of Kefauver-Harris Amendment. The peak of 1962 would not be seen again until early 21st century. By 2016 number of organizations actively involved in R&D at level not seen since 1914.
113.
Baily, M. N. Pre-1962 drug development costs (baily 1972).
Baily (1972) https://samizdathealth.org/wp-content/uploads/2020/12/hlthaff.1.2.6.pdf (1972)
Pre-1962: Average cost per new chemical entity (NCE) was $6.5 million (1980 dollars) Inflation-adjusted to 2024 dollars: $6.5M (1980) ≈ $22.5M (2024), using CPI multiplier of 3.46× Real cost increase (inflation-adjusted): $22.5M (pre-1962) → $2,600M (2024) = 116× increase Note: This represents the most comprehensive academic estimate of pre-1962 drug development costs based on empirical industry data Additional sources: https://samizdathealth.org/wp-content/uploads/2020/12/hlthaff.1.2.6.pdf
.
114.
Think by Numbers. Pre-1962 physician-led clinical trials.
Think by Numbers: How Many Lives Does FDA Save? https://thinkbynumbers.org/health/how-many-net-lives-does-the-fda-save/ (1966)
Pre-1962: Physicians could report real-world evidence directly 1962 Drug Amendments replaced "premarket notification" with "premarket approval", requiring extensive efficacy testing Impact: New regulatory clampdown reduced new treatment production by 70%; lifespan growth declined from 4 years/decade to 2 years/decade Drug Efficacy Study Implementation (DESI): NAS/NRC evaluated 3,400+ drugs approved 1938-1962 for safety only; reviewed >3,000 products, >16,000 therapeutic claims FDA has had authority to accept real-world evidence since 1962, clarified by 21st Century Cures Act (2016) Note: Specific "144,000 physicians" figure not verified in sources Additional sources: https://thinkbynumbers.org/health/how-many-net-lives-does-the-fda-save/ | https://www.fda.gov/drugs/enforcement-activities-fda/drug-efficacy-study-implementation-desi | http://www.nasonline.org/about-nas/history/archives/collections/des-1966-1969-1.html
.
115.
GAO. 95% of diseases have 0 FDA-approved treatments.
GAO https://www.gao.gov/products/gao-25-106774 (2025)
95% of diseases have no treatment Additional sources: https://www.gao.gov/products/gao-25-106774 | https://globalgenes.org/rare-disease-facts/
.
117.
NHS England; Águas et al. RECOVERY trial global lives saved ( 1 million).
NHS England: 1 Million Lives Saved https://www.england.nhs.uk/2021/03/covid-treatment-developed-in-the-nhs-saves-a-million-lives/ (2021)
Dexamethasone saved 1 million lives worldwide (NHS England estimate, March 2021, 9 months after discovery). UK alone: 22,000 lives saved. Methodology: Águas et al. Nature Communications 2021 estimated 650,000 lives (range: 240,000-1,400,000) for July-December 2020 alone, based on RECOVERY trial mortality reductions (36% for ventilated, 18% for oxygen-only patients) applied to global COVID hospitalizations. June 2020 announcement: Dexamethasone reduced deaths by up to 1/3 (ventilated patients), 1/5 (oxygen patients). Impact immediate: Adopted into standard care globally within hours of announcement. Additional sources: https://www.england.nhs.uk/2021/03/covid-treatment-developed-in-the-nhs-saves-a-million-lives/ | https://www.nature.com/articles/s41467-021-21134-2 | https://pharmaceutical-journal.com/article/news/steroid-has-saved-the-lives-of-one-million-covid-19-patients-worldwide-figures-show | https://www.recoverytrial.net/news/recovery-trial-celebrates-two-year-anniversary-of-life-saving-dexamethasone-result
.
120.
National September 11 Memorial & Museum.
September 11 attack facts. (2024)
2,977 people were killed in the September 11, 2001 attacks: 2,753 at the World Trade Center, 184 at the Pentagon, and 40 passengers and crew on United Flight 93 in Shanksville, Pennsylvania.
121.
World Bank. World bank singapore economic data.
World Bank https://data.worldbank.org/country/singapore (2024)
Singapore GDP per capita (2023): $82,000 - among highest in the world Government spending: 15% of GDP (vs US 38%) Life expectancy: 84.1 years (vs US 77.5 years) Singapore demonstrates that low government spending can coexist with excellent outcomes Additional sources: https://data.worldbank.org/country/singapore
.
122.
International Monetary Fund.
IMF singapore government spending data. (2024)
Singapore government spending is approximately 15% of GDP This is 23 percentage points lower than the United States (38%) Despite lower spending, Singapore achieves excellent outcomes: - Life expectancy: 84.1 years (vs US 77.5) - Low crime, world-class infrastructure, AAA credit rating Additional sources: https://www.imf.org/en/Countries/SGP
.
123.
World Health Organization.
WHO life expectancy data by country. (2024)
Life expectancy at birth varies significantly among developed nations: Switzerland: 84.0 years (2023) Singapore: 84.1 years (2023) Japan: 84.3 years (2023) United States: 77.5 years (2023) - 6.5 years below Switzerland, Singapore Global average: 73 years Note: US spends more per capita on healthcare than any other nation, yet achieves lower life expectancy Additional sources: https://www.who.int/data/gho/data/themes/mortality-and-global-health-estimates/ghe-life-expectancy-and-healthy-life-expectancy
.
125.
PMC. Contribution of smoking reduction to life expectancy gains.
PMC: Benefits Smoking Cessation Longevity https://www.ncbi.nlm.nih.gov/pmc/articles/PMC1447499/ (2012)
Population-level: Up to 14% (9% men, 14% women) of total life expectancy gain since 1960 due to tobacco control efforts Individual cessation benefits: Quitting at age 35 adds 6.9-8.5 years (men), 6.1-7.7 years (women) vs continuing smokers By cessation age: Age 25-34 = 10 years gained; age 35-44 = 9 years; age 45-54 = 6 years; age 65 = 2.0 years (men), 3.7 years (women) Cessation before age 40: Reduces death risk by 90% Long-term cessation: 10+ years yields survival comparable to never smokers, averts 10 years of life lost Recent cessation: <3 years averts 5 years of life lost Additional sources: https://www.ncbi.nlm.nih.gov/pmc/articles/PMC1447499/ | https://www.cdc.gov/pcd/issues/2012/11_0295.htm | https://www.ajpmonline.org/article/S0749-3797(24)00217-4/fulltext | https://www.nejm.org/doi/full/10.1056/NEJMsa1211128
.
126.
ICER. Value per QALY (standard economic value).
ICER https://icer.org/wp-content/uploads/2024/02/Reference-Case-4.3.25.pdf (2024)
Standard economic value per QALY: $100,000–$150,000. This is the US and global standard willingness-to-pay threshold for interventions that add costs. Dominant interventions (those that save money while improving health) are favorable regardless of this threshold. Additional sources: https://icer.org/wp-content/uploads/2024/02/Reference-Case-4.3.25.pdf
.
127.
GAO. Annual cost of u.s. Sugar subsidies.
GAO: Sugar Program https://www.gao.gov/products/gao-24-106144 Consumer costs: $2.5-3.5 billion per year (GAO estimate) Net economic cost: $1 billion per year 2022: US consumers paid 2X world price for sugar Program costs $3-4 billion/year but no federal budget impact (costs passed directly to consumers via higher prices) Employment impact: 10,000-20,000 manufacturing jobs lost annually in sugar-reliant industries (confectionery, etc.) Multiple studies confirm: Sweetener Users Association ($2.9-3.5B), AEI ($2.4B consumer cost), Beghin & Elobeid ($2.9-3.5B consumer surplus) Additional sources: https://www.gao.gov/products/gao-24-106144 | https://www.heritage.org/agriculture/report/the-us-sugar-program-bad-consumers-bad-agriculture-and-bad-america | https://www.aei.org/articles/the-u-s-spends-4-billion-a-year-subsidizing-stalinist-style-domestic-sugar-production/
.
128.
World Bank. Swiss military budget as percentage of GDP.
World Bank: Military Expenditure https://data.worldbank.org/indicator/MS.MIL.XPND.GD.ZS?locations=CH 2023: 0.70272% of GDP (World Bank) 2024: CHF 5.95 billion official military spending When including militia system costs: 1% GDP (CHF 8.75B) Comparison: Near bottom in Europe; only Ireland, Malta, Moldova spend less (excluding microstates with no armies) Additional sources: https://data.worldbank.org/indicator/MS.MIL.XPND.GD.ZS?locations=CH | https://www.avenir-suisse.ch/en/blog-defence-spending-switzerland-is-in-better-shape-than-it-seems/ | https://tradingeconomics.com/switzerland/military-expenditure-percent-of-gdp-wb-data.html
.
129.
World Bank. Switzerland vs. US GDP per capita comparison.
World Bank: Switzerland GDP Per Capita https://data.worldbank.org/indicator/NY.GDP.PCAP.CD?locations=CH 2024 GDP per capita (PPP-adjusted): Switzerland $93,819 vs United States $75,492 Switzerland’s GDP per capita 24% higher than US when adjusted for purchasing power parity Nominal 2024: Switzerland $103,670 vs US $85,810 Additional sources: https://data.worldbank.org/indicator/NY.GDP.PCAP.CD?locations=CH | https://tradingeconomics.com/switzerland/gdp-per-capita-ppp | https://www.theglobaleconomy.com/USA/gdp_per_capita_ppp/
.
130.
OECD.
OECD government spending as percentage of GDP. (2024)
OECD government spending data shows significant variation among developed nations: United States: 38.0% of GDP (2023) Switzerland: 35.0% of GDP - 3 percentage points lower than US Singapore: 15.0% of GDP - 23 percentage points lower than US (per IMF data) OECD average: approximately 40% of GDP Additional sources: https://data.oecd.org/gga/general-government-spending.htm
.
131.
OECD.
OECD median household income comparison. (2024)
Median household disposable income varies significantly across OECD nations: United States: $77,500 (2023) Switzerland: $55,000 PPP-adjusted (lower nominal but comparable purchasing power) Singapore: $75,000 PPP-adjusted Additional sources: https://data.oecd.org/hha/household-disposable-income.htm
.
132.
Wikipedia. Thalidomide scandal: Worldwide cases and mortality.
Wikipedia https://en.wikipedia.org/wiki/Thalidomide_scandal The total number of embryos affected by the use of thalidomide during pregnancy is estimated at 10,000, of whom about 40% died around the time of birth. More than 10,000 children in 46 countries were born with deformities such as phocomelia. Additional sources: https://en.wikipedia.org/wiki/Thalidomide_scandal
.
133.
PLOS One. Health and quality of life of thalidomide survivors as they age.
PLOS One https://journals.plos.org/plosone/article?id=10.1371/journal.pone.0210222 (2019)
Study of thalidomide survivors documenting ongoing disability impacts, quality of life, and long-term health outcomes. Survivors (now in their 60s) continue to experience significant disability from limb deformities, organ damage, and other effects. Additional sources: https://journals.plos.org/plosone/article?id=10.1371/journal.pone.0210222
.
135.
FDA Study via NCBI. Trial costs, FDA study.
FDA Study via NCBI https://www.ncbi.nlm.nih.gov/pmc/articles/PMC6248200/ Overall, the 138 clinical trials had an estimated median (IQR) cost of $19.0 million ($12.2 million-$33.1 million)... The clinical trials cost a median (IQR) of $41,117 ($31,802-$82,362) per patient. Additional sources: https://www.ncbi.nlm.nih.gov/pmc/articles/PMC6248200/
.
136.
GBD 2019 Diseases and Injuries Collaborators.
Global burden of disease study 2019: Disability weights.
The Lancet 396, 1204–1222 (2020)
Disability weights for 235 health states used in Global Burden of Disease calculations. Weights range from 0 (perfect health) to 1 (death equivalent). Chronic conditions like diabetes (0.05-0.35), COPD (0.04-0.41), depression (0.15-0.66), and cardiovascular disease (0.04-0.57) show substantial variation by severity. Treatment typically reduces disability weights by 50-80 percent for manageable chronic conditions.
137.
WHO. Annual global economic burden of alzheimer’s and other dementias.
WHO: Dementia Fact Sheet https://www.who.int/news-room/fact-sheets/detail/dementia (2019)
Global cost: $1.3 trillion (2019 WHO-commissioned study) 50% from informal caregivers (family/friends, 5 hrs/day) 74% of costs in high-income countries despite 61% of patients in LMICs $818B (2010) → $1T (2018) → $1.3T (2019) - rapid growth Note: Costs increased 35% from 2010-2015 alone. Informal care represents massive hidden economic burden Additional sources: https://www.who.int/news-room/fact-sheets/detail/dementia | https://alz-journals.onlinelibrary.wiley.com/doi/10.1002/alz.12901
.
138.
JAMA Oncology. Annual global economic burden of cancer.
JAMA Oncology: Global Cost 2020-2050 https://jamanetwork.com/journals/jamaoncology/fullarticle/2801798 (2020)
2020-2050 projection: $25.2 trillion total ($840B/year average) 2010 annual cost: $1.16 trillion (direct costs only) Recent estimate: $3 trillion/year (all costs included) Top 5 cancers: lung (15.4%), colon/rectum (10.9%), breast (7.7%), liver (6.5%), leukemia (6.3%) Note: China/US account for 45% of global burden; 75% of deaths in LMICs but only 50.0% of economic cost Additional sources: https://jamanetwork.com/journals/jamaoncology/fullarticle/2801798 | https://www.nature.com/articles/d41586-023-00634-9
.
140.
Diabetes Care. Annual global economic burden of diabetes.
Diabetes Care: Global Economic Burden https://diabetesjournals.org/care/article/41/5/963/36522/Global-Economic-Burden-of-Diabetes-in-Adults 2015: $1.3 trillion (1.8% of global GDP) 2030 projections: $2.1T-2.5T depending on scenario IDF health expenditure: $760B (2019) → $845B (2045 projected) 2/3 direct medical costs ($857B), 1/3 indirect costs (lost productivity) Note: Costs growing rapidly; expected to exceed $2T by 2030 Additional sources: https://diabetesjournals.org/care/article/41/5/963/36522/Global-Economic-Burden-of-Diabetes-in-Adults | https://doi.org/10.1016/S2213-8587(17)30097-9
.
142.
World Bank, Bureau of Economic Analysis. US GDP 2024 ($28.78 trillion).
World Bank https://data.worldbank.org/indicator/NY.GDP.MKTP.CD?locations=US (2024)
US GDP reached $28.78 trillion in 2024, representing approximately 26% of global GDP. Additional sources: https://data.worldbank.org/indicator/NY.GDP.MKTP.CD?locations=US | https://www.bea.gov/news/2024/gross-domestic-product-fourth-quarter-and-year-2024-advance-estimate
.
143.
Environmental Working Group. US farm subsidy database and analysis.
Environmental Working Group https://farm.ewg.org/ (2024)
US agricultural subsidies total approximately $30 billion annually, but create much larger economic distortions. Top 10% of farms receive 78% of subsidies, benefits concentrated in commodity crops (corn, soy, wheat, cotton), environmental damage from monoculture incentivized, and overall deadweight loss estimated at $50-120 billion annually. Additional sources: https://farm.ewg.org/ | https://www.ers.usda.gov/topics/farm-economy/farm-sector-income-finances/government-payments-the-safety-net/
.
144.
Drug Policy Alliance.
The drug war by the numbers. (2021)
Since 1971, the war on drugs has cost the United States an estimated $1 trillion in enforcement. The federal drug control budget was $41 billion in 2022. Mass incarceration costs the U.S. at least $182 billion every year, with over $450 billion spent to incarcerate individuals on drug charges in federal prisons.
145.
International Monetary Fund.
IMF fossil fuel subsidies data: 2023 update. (2023)
Globally, fossil fuel subsidies were $7 trillion in 2022 or 7.1 percent of GDP. The United States subsidies totaled $649 billion. Underpricing for local air pollution costs and climate damages are the largest contributor, accounting for about 30 percent each.
146.
Papanicolas, Irene et al. Health care spending in the united states and other high-income countries.
Papanicolas et al. https://jamanetwork.com/journals/jama/article-abstract/2674671 (2018)
The US spent approximately twice as much as other high-income countries on medical care (mean per capita: $9,892 vs $5,289), with similar utilization but much higher prices. Administrative costs accounted for 8% of US spending vs 1-3% in other countries. US spending on pharmaceuticals was $1,443 per capita vs $749 elsewhere. Despite spending more, US health outcomes are not better. Additional sources: https://jamanetwork.com/journals/jama/article-abstract/2674671
.
147.
Hsieh, C.-T. & Moretti, E. Housing constraints and spatial misallocation.
American Economic Journal: Macroeconomics https://www.aeaweb.org/articles?id=10.1257/mac.20170388 (2019)
We quantify the amount of spatial misallocation of labor across US cities and its aggregate costs. Tight land-use restrictions in high-productivity cities like New York, San Francisco, and Boston lowered aggregate US growth by 36% from 1964 to 2009. Local constraints on housing supply have had enormous effects on the national economy. Additional sources: https://www.aeaweb.org/articles?id=10.1257/mac.20170388
.
149.
Tax Foundation. Tax compliance costs the US economy $546 billion annually.
https://taxfoundation.org/data/all/federal/irs-tax-compliance-costs/ (2024)
Americans will spend over 7.9 billion hours complying with IRS tax filing and reporting requirements in 2024. This costs the economy roughly $413 billion in lost productivity. In addition, the IRS estimates that Americans spend roughly $133 billion annually in out-of-pocket costs, bringing the total compliance costs to $546 billion, or nearly 2 percent of GDP.
150.
Cook, C., Cole, G., Asaria, P., Jabbour, R. & Francis, D. P. Annual global economic burden of heart disease.
International Journal of Cardiology https://www.internationaljournalofcardiology.com/article/S0167-5273(13)02238-9/abstract (2014)
Heart failure alone: $108 billion/year (2012 global analysis, 197 countries) US CVD: $555B (2016) → projected $1.8T by 2050 LMICs total CVD loss: $3.7T cumulative (2011-2015, 5-year period) CVD is costliest disease category in most developed nations Note: No single $2.1T global figure found; estimates vary widely by scope and year Additional sources: https://www.ahajournals.org/doi/10.1161/CIR.0000000000001258
.
151.
Source: US Life Expectancy FDA Budget 1543-2019 CSV.
US life expectancy growth 1880-1960: 3.82 years per decade. (2019)
Pre-1962: 3.82 years/decade Post-1962: 1.54 years/decade Reduction: 60% decline in life expectancy growth rate Additional sources: https://ourworldindata.org/life-expectancy | https://www.mortality.org/ | https://www.cdc.gov/nchs/nvss/mortality_tables.htm
.
152.
Source: US Life Expectancy FDA Budget 1543-2019 CSV.
Post-1962 slowdown in life expectancy gains. (2019)
Pre-1962 (1880-1960): 3.82 years/decade Post-1962 (1962-2019): 1.54 years/decade Reduction: 60% decline Temporal correlation: Slowdown occurred immediately after 1962 Kefauver-Harris Amendment Additional sources: https://ourworldindata.org/life-expectancy | https://www.mortality.org/ | https://www.cdc.gov/nchs/nvss/mortality_tables.htm
.
153.
Centers for Disease Control and Prevention.
US life expectancy 2023. (2024)
US life expectancy at birth was 77.5 years in 2023 Male life expectancy: 74.8 years Female life expectancy: 80.2 years This is 6-7 years lower than peer developed nations despite higher healthcare spending Additional sources: https://www.cdc.gov/nchs/fastats/life-expectancy.htm
.
154.
US Census Bureau.
US median household income 2023. (2024)
US median household income was $77,500 in 2023 Real median household income declined 0.8% from 2022 Gini index: 0.467 (income inequality measure) Additional sources: https://www.census.gov/library/publications/2024/demo/p60-282.html
.
155.
Manuel, D. U.s. Defense spending history: 100 years of military budgets.
DaveManuel.com https://www.davemanuel.com/us-defense-spending-history-military-budget-data.php (2025)
US military spending in constant 2024 dollars: 1939 $29B (pre-WW2 baseline), 1940 $37B, 1944 $1,383B, 1945 $1,420B (peak), 1946 $674B, 1947 $176B, 1948 $117B, 2024 $886B. The post-WW2 demobilization cut spending 88% in two years (1945-1947). Current peacetime spending ($886B) is 30x the pre-WW2 baseline and 62% of peak WW2 spending, in inflation-adjusted dollars.
156.
Statista. US military budget as percentage of GDP.
Statista https://www.statista.com/statistics/262742/countries-with-the-highest-military-spending/ (2024)
U.S. military spending amounted to 3.5% of GDP in 2024. In 2024, the U.S. spent nearly $1 trillion on its military budget, equal to 3.4% of GDP. Additional sources: https://www.statista.com/statistics/262742/countries-with-the-highest-military-spending/ | https://www.sipri.org/sites/default/files/2025-04/2504_fs_milex_2024.pdf
.
157.
US Census Bureau. Number of registered or eligible voters in the u.s.
US Census Bureau https://www.census.gov/newsroom/press-releases/2025/2024-presidential-election-voting-registration-tables.html (2024)
73.6% (or 174 million people) of the citizen voting-age population was registered to vote in 2024 (Census Bureau). More than 211 million citizens were active registered voters (86.6% of citizen voting age population) according to the Election Assistance Commission. Additional sources: https://www.census.gov/newsroom/press-releases/2025/2024-presidential-election-voting-registration-tables.html | https://www.eac.gov/news/2025/06/30/us-election-assistance-commission-releases-2024-election-administration-and-voting
.
158.
U.S. Senate. Treaties.
U.S. Senate https://www.senate.gov/about/powers-procedures/treaties.htm The Constitution provides that the president ’shall have Power, by and with the Advice and Consent of the Senate, to make Treaties, provided two-thirds of the Senators present concur’ (Article II, section 2). Treaties are formal agreements with foreign nations that require two-thirds Senate approval. 67 senators (two-thirds of 100) must vote to ratify a treaty for it to take effect. Additional sources: https://www.senate.gov/about/powers-procedures/treaties.htm
.
160.
Federal Election Commission.
Statistical summary of 24-month campaign activity of the 2023-2024 election cycle. (2023)
Presidential candidates raised $2 billion; House and Senate candidates raised $3.8 billion and spent $3.7 billion; PACs raised $15.7 billion and spent $15.5 billion. Total federal campaign spending approximately $20 billion. Additional sources: https://www.fec.gov/updates/statistical-summary-of-24-month-campaign-activity-of-the-2023-2024-election-cycle/
.
161.
OpenSecrets.
Federal lobbying hit record $4.4 billion in 2024. (2024)
Total federal lobbying reached record $4.4 billion in 2024. The $150 million increase in lobbying continues an upward trend that began in 2016. Additional sources: https://www.opensecrets.org/news/2025/02/federal-lobbying-set-new-record-in-2024/
.
162.
Columbia/NBER. Odds of a single vote being decisive in a u.s. Presidential election.
Columbia/NBER: What Is the Probability Your Vote Will Make a Difference? https://sites.stat.columbia.edu/gelman/research/published/probdecisive2.pdf (2012)
National average: 1 in 60 million chance (2008 election analysis by Gelman, Silver, Edlin) Swing states (NM, VA, NH, CO): 1 in 10 million chance Non-competitive states: 34 states >1 in 100 million odds; 20 states >1 in 1 billion Washington DC: 1 in 490 billion odds Methodology: Probability state is necessary for electoral college win × probability state vote is tied Additional sources: https://sites.stat.columbia.edu/gelman/research/published/probdecisive2.pdf | https://onlinelibrary.wiley.com/doi/abs/10.1111/j.1465-7295.2010.00272.x
.
163.
Hutchinson and Kirk.
Valley of death in drug development. (2011)
The overall failure rate of drugs that passed into Phase 1 trials to final approval is 90%. This lack of translation from promising preclinical findings to success in human trials is known as the "valley of death." Estimated 30-50% of promising compounds never proceed to Phase 2/3 trials primarily due to funding barriers rather than scientific failure. The late-stage attrition rate for oncology drugs is as high as 70% in Phase II and 59% in Phase III trials.
164.
DOT. DOT value of statistical life ($13.6M).
DOT: VSL Guidance 2024 https://www.transportation.gov/office-policy/transportation-policy/revised-departmental-guidance-on-valuation-of-a-statistical-life-in-economic-analysis (2024)
Current VSL (2024): $13.7 million (updated from $13.6M) Used in cost-benefit analyses for transportation regulations and infrastructure Methodology updated in 2013 guidance, adjusted annually for inflation and real income VSL represents aggregate willingness to pay for safety improvements that reduce fatalities by one Note: DOT has published VSL guidance periodically since 1993. Current $13.7M reflects 2024 inflation/income adjustments Additional sources: https://www.transportation.gov/office-policy/transportation-policy/revised-departmental-guidance-on-valuation-of-a-statistical-life-in-economic-analysis | https://www.transportation.gov/regulations/economic-values-used-in-analysis
.
165.
PLOS ONE. Cost per DALY for vitamin a supplementation.
PLOS ONE: Cost-effectiveness of "Golden Mustard" for Treating Vitamin A Deficiency in India (2010) https://journals.plos.org/plosone/article?id=10.1371/journal.pone.0012046 (2010)
India: $23-$50 per DALY averted (least costly intervention, $1,000-$6,100 per death averted) Sub-Saharan Africa (2022): $220-$860 per DALY (Burkina Faso: $220, Kenya: $550, Nigeria: $860) WHO estimates for Africa: $40 per DALY for fortification, $255 for supplementation Uganda fortification: $18-$82 per DALY (oil: $18, sugar: $82) Note: Wide variation reflects differences in baseline VAD prevalence, coverage levels, and whether intervention is supplementation or fortification Additional sources: https://journals.plos.org/plosone/article?id=10.1371/journal.pone.0012046 | https://journals.plos.org/plosone/article?id=10.1371/journal.pone.0266495
.
168.
PMC. Cost-effectiveness threshold ($50,000/QALY).
PMC https://pmc.ncbi.nlm.nih.gov/articles/PMC5193154/ The $50,000/QALY threshold is widely used in US health economics literature, originating from dialysis cost benchmarks in the 1980s. In US cost-utility analyses, 77.5% of authors use either $50,000 or $100,000 per QALY as reference points. Most successful health programs cost $3,000-10,000 per QALY. WHO-CHOICE uses GDP per capita multiples (1× GDP/capita = "very cost-effective", 3× GDP/capita = "cost-effective"), which for the US ( $70,000 GDP/capita) translates to $70,000-$210,000/QALY thresholds. Additional sources: https://pmc.ncbi.nlm.nih.gov/articles/PMC5193154/ | https://pmc.ncbi.nlm.nih.gov/articles/PMC9278384/
.
169.
Integrated Benefits Institute. Chronic illness workforce productivity loss.
Integrated Benefits Institute 2024 https://www.ibiweb.org/resources/chronic-conditions-in-the-us-workforce-prevalence-trends-and-productivity-impacts (2024)
78.4% of U.S. employees have at least one chronic condition (7% increase since 2021) 58% of employees report physical chronic health conditions 28% of all employees experience productivity loss due to chronic conditions Average productivity loss: $4,798 per employee per year Employees with 3+ chronic conditions miss 7.8 days annually vs 2.2 days for those without Note: 28% productivity loss translates to roughly 11 hours per week (28% of 40-hour workweek) Additional sources: https://www.ibiweb.org/resources/chronic-conditions-in-the-us-workforce-prevalence-trends-and-productivity-impacts | https://www.onemedical.com/mediacenter/study-finds-more-than-half-of-employees-are-living-with-chronic-conditions-including-1-in-3-gen-z-and-millennial-employees/ | https://debeaumont.org/news/2025/poll-the-toll-of-chronic-health-conditions-on-employees-and-workplaces/
.
171.
Sinn, M. P.
Incentive Alignment Bonds: Making Public Goods Financially and Politically Profitable.
https://manual.warondisease.org/knowledge/appendix/incentive-alignment-bonds-paper.html (2025) doi:
10.5281/zenodo.18203221 Government spending is optimized for lobbying intensity, not net societal value. Programs with 100:1 benefit-cost ratios get billions while programs with negative returns get hundreds of billions. Incentive Alignment Bonds flip this by creating a capital pool that rewards politicians (via campaign support and post-office opportunities) for funding high-NSV programs over low-NSV alternatives. The result: public good becomes private profit for both investors and elected officials.
172.
Pape, R. A.
Dying to Win: The Strategic Logic of Suicide Terrorism. (Random House, 2005).
Pape analyzed every suicide terrorist attack worldwide from 1980 to 2003, finding that 95 percent were in response to foreign military occupation. The data contradicts narratives attributing suicide terrorism primarily to religious fundamentalism.
173.
Brown University. War on terror cost and unintended consequences.
Brown University https://www.brown.edu/news/2021-09-01/costsofwar (2021)
20 years of post-9/11 wars cost the U.S. an estimated $8 trillion and killed more than 900,000 people. Breakdown: $2.1T DOD operations, $1.1T homeland security, $1.1T interest on borrowing, $884B DOD base budget increases, $465B veterans’ care, $2.3T Afghanistan/Pakistan, $2.1T Iraq/Syria. Future: $2.2T for veteran care already set aside. Additional sources: https://www.brown.edu/news/2021-09-01/costsofwar | https://watson.brown.edu/costsofwar/costs/economic
.
174.
Jones, S. G. Terrorism before and during the war on terror: A look at the numbers.
War on the Rocks https://warontherocks.com/2017/12/terrorism-war-terror-look-numbers/ (2017)
Analysis of terrorism trends showing dramatic increase in global terrorist attacks after 2001, with attacks rising from roughly 1,000 per year in 2004 to nearly 17,000 by 2014, driven primarily by proliferation of jihadist organizations in Iraq, Afghanistan, Pakistan, Nigeria, and Syria.
175.
Sinn, M. P.
Wishocracy: Solving the Democratic Principal-Agent Problem Through Pairwise Preference Aggregation.
https://manual.warondisease.org/knowledge/appendix/wishocracy-paper.html (2025) doi:
10.5281/zenodo.18205881 Representative democracy suffers from an inescapable principal-agent problem where elected officials’ incentives diverge from citizen welfare. Wishocracy introduces RAPPA (Randomized Aggregated Pairwise Preference Allocation), which aggregates citizen preferences through cognitively tractable pairwise comparisons and creates accountability via Citizen Alignment Scores that channel electoral resources toward politicians who actually represent what citizens want.
177.
Sinn, M. P.
The 1% Treaty: An Incentive-Compatible Approach to Ending War and Disease.
https://manual.warondisease.org/knowledge/economics/1-pct-treaty-impact.html (2025) doi:
10.5281/zenodo.18161560 6.65 thousand diseases have zero FDA-approved treatments; at current trial capacity, exploring them takes 443 years. Redirecting 1% of military spending scales capacity 12.3x, cutting the timeline to 36 years and preventing 10.7 billion deaths. At $0.00177/DALY, 50.3kx more cost-effective than the best existing interventions. Incentive Alignment Bonds make adoption politically viable.