Correlation between public opinion and policy outcomes: 0%.
Your species makes decisions by whoever has the most papers to give the people who survive a popularity contest held every four years among people who were too busy to research the contestants. You call this “democracy,” which is Greek for “rule by the people,” in the same way that “waterboarding” is about water.
Your chance of deciding a presidential election is 1 in 60 million162. You are more likely to die driving to the polls. The expected value of your vote: $0.000338 (95% CI: $0.000334-$0.000343). The cost of casting it (time, transportation, parking, standing in line behind a man arguing about his ID, a woman who brought her dog, and a voting machine manufactured by a company that donates to one of the candidates): about $50. You lose money voting. This is called “civic duty,” which means “a financial loss you perform in formal clothing.”
Princeton University analyzed 1,779 policy decisions over 20 years. The correlation between what ordinary voters want and what actually becomes law: zero percent170.
Not “low.” Not “disappointing.” Zero. Your democracy correlates with your preferences the way a coin flip correlates with your breakfast.
When economic elites want something, it happens 78% of the time170. When you want something, it happens 30% of the time, regardless of whether 0% or 100% of you want it. The line is flat. A graph of your political influence looks like an EKG of a dead person.
You have the same political influence as your houseplant. Less, actually. Your houseplant produces oxygen, which at least one congressman needs.
Your institutions already know this. You have a “Department of Defense” that mainly attacks people. A “Department of Health” that has not yet produced any observable health. And a “Department of Justice” that… well. You named your planet dirt. Naming is not your strength.
Whether 0% or 100% of voters support a bill, it has the same chance of passing. The line is flat.
The Mathematics of Why Nobody Fixes Anything
Concentrated Benefits vs. Diffuse Costs
Sugar subsidies cost Americans $3.5 billion per year127. That’s $10 per person.
Nobody takes a day off work, drives to the capitol, and stands in a hallway to save $10. Sugar companies spend millions to keep their $3.5 billion. Obviously.
That is the entire explanation for why your government does what it does. The crime hides in the details, which is why there are so many of them.
There is a word for this. The word is “beige crime”: theft so boring that nobody investigates it. Your best criminals discovered long ago that the boredom threshold of the average citizen is approximately $10. Steal more than that from one person and they complain. Steal $10 from 330 million people and the thief receives an industry award.
The pattern repeats everywhere, like wallpaper in a prison:
Pharma: $500 billion in profits (concentrated)171. Patients: $1,500 each (diffuse). Winner: pharma (obviously).
Banks in 2008: $700 billion bailout (concentrated)172. Taxpayers: $2,100 each (diffuse). Winner: banks (obviously).
Sugar: $3.5 billion in subsidies (concentrated). You: $10 (not worth a phone call). Winner: sugar (obviously).
The small group hires lobbyists. You hire nobody. This is called “representative democracy,” which represents you in the same way a casino represents financial planning.
A hundred million people are robbed of one dollar each and not one of them considers it worth getting out of the chair. The dollar is the perfect amount to steal.
The Death Spiral: How Two Choices Kill 330 Million Options
A human named James Surowiecki proved that crowds outperform experts under four conditions: diversity of opinion, independence of judgment, decentralization, and a good aggregation mechanism17. Fish figured this out by accident. Your political scientists spent 200 years and several revolutions to reach the same conclusion. The fish were faster.
Your democracy has three of these conditions. It systematically destroys the most important one. A human named Charles Mackay described the result in 1841: the wisdom of crowds becomes the madness of crowds173. He was ignored, obviously.
Independence means each person decides based on their own knowledge, not by watching everyone else. Your voting system annihilates this. You have 330 million people. You choose between two of them, pre-selected by a process optimized for fundraising, name recognition, and not offending people who vote in primaries (which is approximately nine people per state, seven of whom are angry).
The system does not even let you vote for the one you like. It makes you vote against the one you fear. This is called “strategic voting,” which means a ballot stops measuring what anyone wants and starts measuring what each voter thinks everyone else will do. That is not independence. That is a herd, and it is built that way.
You can observe this same phenomenon in army ants.
Army ants are nearly blind174. They navigate by following pheromone trails laid by the ants ahead of them. When a foraging column gets separated from the main trail, the leading ants have nothing to follow, so they wander. But they’re still laying pheromone as they walk. If the front of the column curves enough to cross its own trail, the leaders pick up that signal and follow it. The circle closes. Every ant is now both following and reinforcing the path that traps it. They march in a loop, sometimes hundreds of thousands strong, until they die of exhaustion.
No individual ant is stupid. Each is following a perfectly rational rule: follow the strongest signal. The system is stupid. The circle emerges not from bad ants but from a structure where no ant can navigate independently.
Your two-party system is a death spiral with bumper stickers. Pollsters tell you who’s “electable.” Media covers the two “real” candidates. Donors fund the two “viable” options. Everyone votes for one of the two because everyone else is voting for one of the two, because everyone else is voting for one of the two. The best candidate out of 330 million people could be standing right there, but if they’re not wearing the right color tie, they’re “throwing their vote away” (a phrase that only makes sense in a system designed to waste votes).
The result: a nation of 330 million, selecting from a talent pool of 330 million, reliably produces a choice between two people that approximately nobody is enthusiastic about. An engineer would classify this as a math error. Your species classifies it as “freedom.”
Each ant follows the one ahead. The leader follows the last. They march in a circle until they die. Your two-party system works the same way, but the circle takes four years. (Clemzouzou69, CC BY-SA 4.0)
How Money Buys Your Government
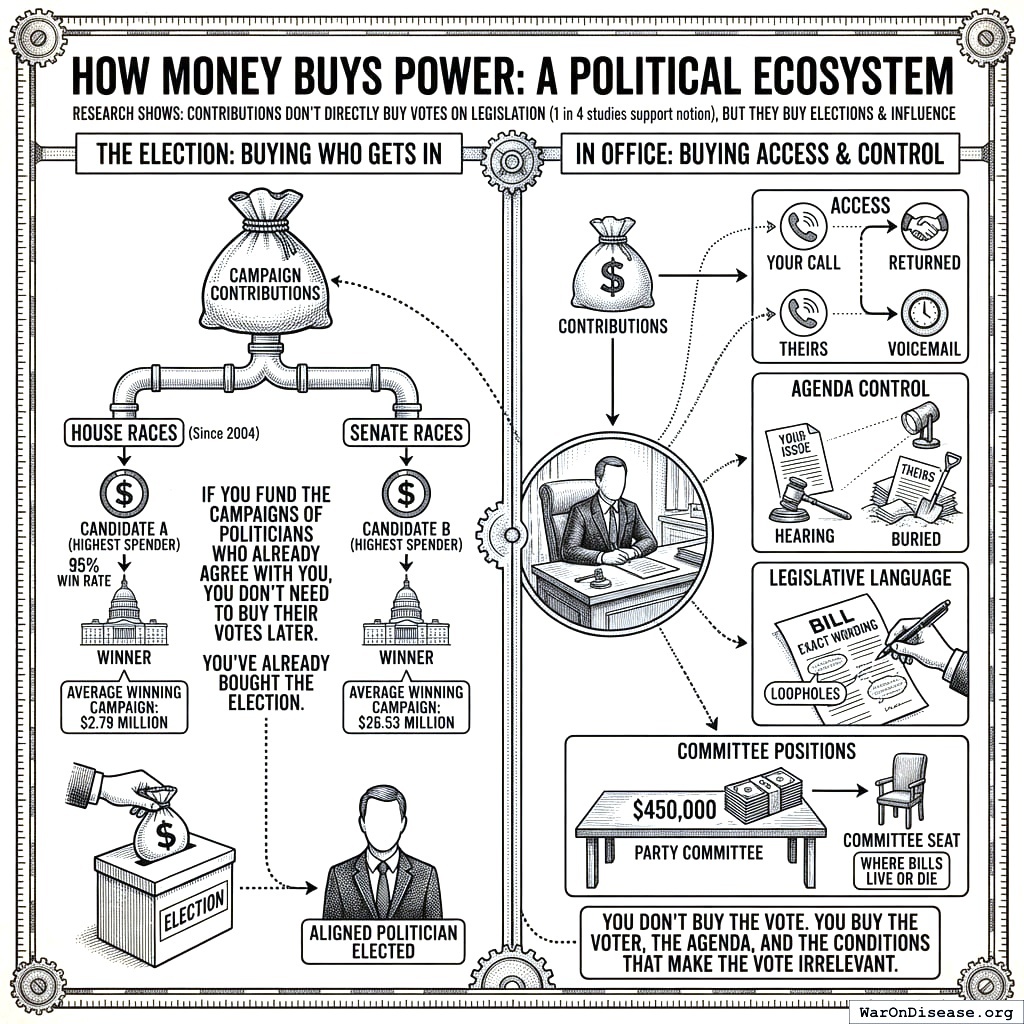
Giving someone papers so they’ll do what you want is called “bribery.” Your species calls it “campaign finance.” The distinction matters, but not in the way you think. Campaign contributions don’t directly buy how politicians vote. Only 1 in 4 studies even support that175. The system is much more elegant than direct bribery.
Money buys votes. Votes buy power. Power buys money. It’s a circle. Calling it a “cycle” makes it sound natural.
What money actually buys is which politicians exist in the first place:
95% of House races since 2004: won by whoever had more papers175
Average winning House campaign: $2.79 million175 (less than a nice apartment in Manhattan, and arguably less useful)
Average winning Senate campaign: $26.53 million175 (a senator costs more, presumably because there are fewer of them, like truffles)
Why bribe a politician when you can manufacture one who already agrees with you? Why train the dog when you can buy a dog that already sits?
For the ones already sitting, papers buy something more useful than votes:
Access: Your call gets returned. Everyone else gets voicemail. (Voicemail is where democracy goes to die.)
Agenda control: Your issue gets a hearing. Everyone else’s gets a filing cabinet.
Legislative language: The exact wording that creates the exact loopholes you need.
Committee positions: $450,000 to party committees175 buys a seat where bills live or die.
You don’t buy the vote. You buy the voter, the agenda, and the room where the vote happens. Then the vote takes care of itself. This is like rigging a horse race by buying the horse, the jockey, the track, and the concept of racing.
The Lobbying ROI: Better Than Every Other Investment
The most profitable investment on your planet is not stocks, real estate, or cryptocurrency. It’s congressmen:
Disease advocacy groups give: $100 million in papers to lobbyists176
They receive: $1.8 billion in papers from the government176
Return: 18 to 1 (1,700% net)
Your stock market returns about 10% per year. Your congressmen return 1,700%. This is not a metaphor. These are the actual numbers. A stockbroker offering 1,700% gets reported to the police. A congressman offering it gets reclassified as “advocacy.” The only reason more people don’t invest in congressmen is that the minimum buy-in requires a trade association, which requires being rich (which is the entire point).
The 18-to-1 return means your disease funding is allocated by lobbying power, not by who’s dying. Diseases with celebrity spokespeople and well-funded advocacy groups get research budgets. Diseases that kill quietly, in populations too poor or too young to organize, get nothing. A disease that can’t hire a lobbying firm isn’t a real disease. It’s just dying, which doesn’t have a PAC.
Your Congressman: A Professional Fundraiser Who Occasionally Dabbles in Legislation
I studied how your elected representatives spend their time. I assumed they spent it representing. I was incorrect.
Reading the laws they’re about to vote on: whatever’s left (roughly 1 hour)
Laws that need reading: 6 hours’ worth
That last part is important. The 110th Congress dealt with 7,441 bills totaling 125,000 pages178. The House was in session 294 days. That is 425 pages per working day. At normal human reading speed, 6 hours. They have 1. They would need to read at six times normal speed. There is a word for creatures that process information six times faster than their biology allows. The word is “lying.”
They do not read what they vote on. But it gets worse (on Earth, it always gets worse): they often do not write what they vote on, either.
In 2013, the House passed a bill to weaken financial regulations. Of its 85 lines, 70 were written by Citigroup lobbyists179. Two paragraphs were copied word for word; the only change was making two words plural. The bank wrote a law to deregulate itself, handed it to Congress, and Congress passed it. This is like letting the burglar write the building codes. (On your planet, this actually happened.)
Over eight years, at least 10,000 bills copied from corporate templates were introduced in state legislatures. More than 2,100 became law180. Corporations draft the language, hand it to legislators, and legislators hit paste. No sane auditor would call this “authorship.” The person holding the stamp provides no function except the stamp. The word for that is “rubber.” Your species chose the word “representative.”
The PATRIOT Act: 342 pages, voted on 45 minutes after release181. That is 7.6 pages per minute. The Affordable Care Act: 2,700 pages, described by the Speaker of the House as something “we have to pass to see what’s in it”182. No sane employer would let someone who approved a 2,700-page document without reading it operate heavy machinery. These people operate nuclear weapons. (And they didn’t read the manual for those either, presumably.)
Congressional Committees: The Menu
Committees control which bills live or die. Both parties assign fundraising quotas for each seat183: raise this many papers for the party, or lose your assignment. Don’t hit your number? Your bills die, your amendments vanish, and your name goes on a literal “wall of shame”183.
Here is the menu. It has prices, like a restaurant, except the food is legislation, the waiters had to buy their own sections, and the kitchen is run by whoever tips the most.
Position
Democrats (DCCC)
Republicans (NRCC)
What You’re Buying
House Speaker
$31 million
$20 million
The entire legislative agenda (everything)
Ways & Means Chair
$1.8 million
$1.2 million
All tax laws (every tax)
Appropriations Chair
$1.8 million
$1.2 million
$1.7 trillion budget (most of the papers)
Energy & Commerce
$1.8 million
$1.2 million
Healthcare, energy, telecom (your body, your lights, your phone)
Regular Committee
$500K-1M
$875,000
More than nothing (barely)
Basic Member
$150,000+
Varies
Entry fee (to a building you were elected to enter)
The House Speaker must raise $31 million for Democrats or $20 million for Republicans, and in exchange controls the entire legislative agenda. A chair on Ways and Means or Appropriations costs $1.8 million and buys control over all tax law or the $1.7 trillion federal budget. Energy and Commerce, which controls healthcare, energy, and telecom, costs the same. A regular committee seat runs $500,000 to a million. Even the basic entry fee for a freshly elected member is $150,000, which is rent on a building you were elected to enter.
This is why congressmen spend 4 hours a day fundraising. They’re not campaigning. They’re paying rent. The people writing your healthcare laws bought their positions from the industries those laws regulate. On your planet, this is called “the system working.”
An accountant would just call it “the system.”
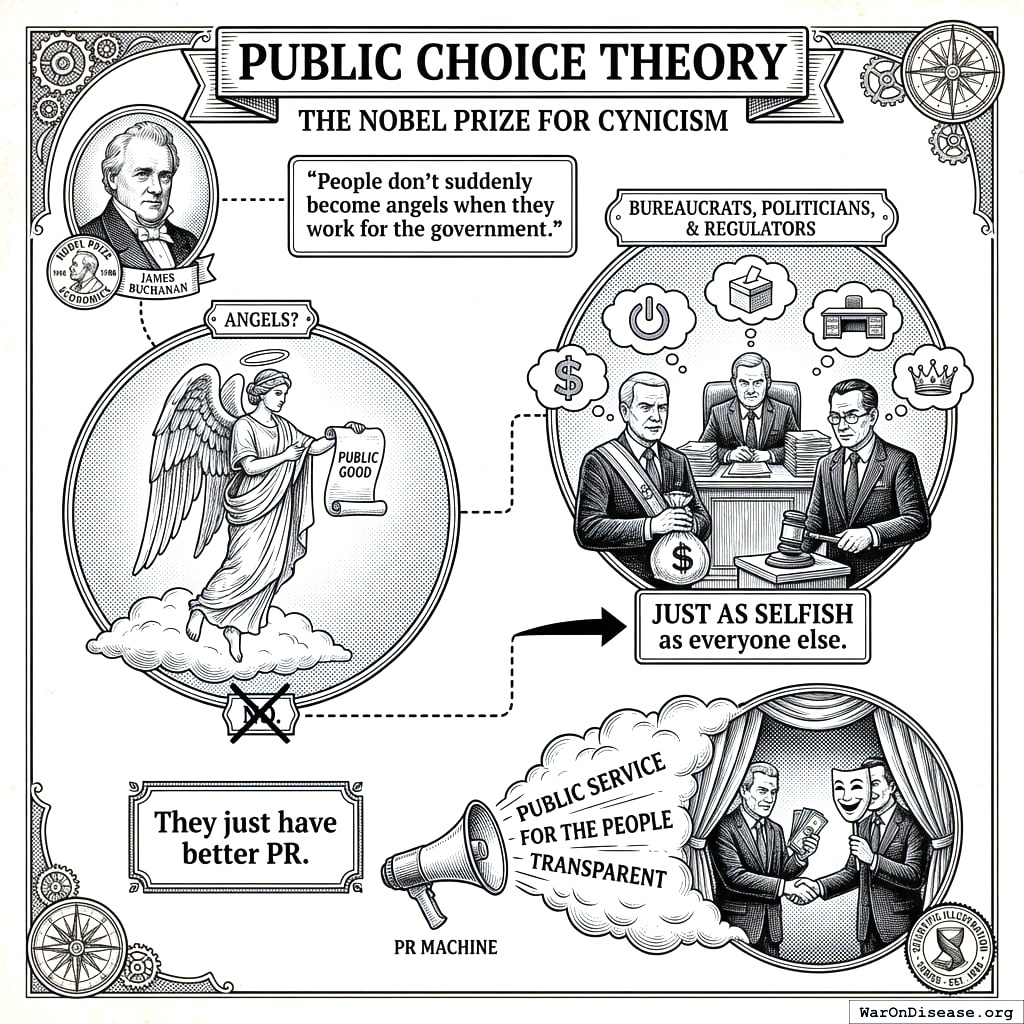
Public Choice Theory (Or: The Nobel Prize for Cynicism)
In 1986, a human named James Buchanan won what is technically not a Nobel Prize (see central banks chapter) in Economics184 for formally proving something that every organism on every planet already knew:
Humans do not become better humans when you give them a government ID badge.
This is Public Choice Theory. Bureaucrats, politicians, and regulators are exactly as selfish as everyone else. The only difference is that when a corporation is greedy, you can stop buying its product. When a government agency is greedy, it can arrest you for not buying its product. (This is called “regulation,” which means “mandatory purchase.”)
Corporations want money. Government agencies want money. One group is expected to be greedy. The other is expected to be noble. Both groups want money.
What Each Institution Actually Optimizes For
Actor
What It Says on the Door
What It Actually Does
Result
NIH
“Cures”
Awards grants (to itself)
No cures
FDA
“Lives saved”
Avoids blame
Deadly delays
Congress
“Voter welfare”
Collects papers from corporations
Corporate welfare
Pharma
“Health outcomes”
Recurring revenue (cures are bad for business)
Chronic disease preferred
Military Contractor
“National security”
Government contracts (forever)
Endless wars
Any organism that controls its own food supply eventually optimizes for feeding itself. The surprise is not that your institutions do this. The surprise is that you keep expecting them not to.
Nobody in this system is incentivized to cure disease or end war. You could elect 535 clones of your most idealistic human and within two years they’d be collecting papers from pharmaceutical companies, because the system requires it and the system does not care who you put inside it. It digests idealists the way a stomach digests food.
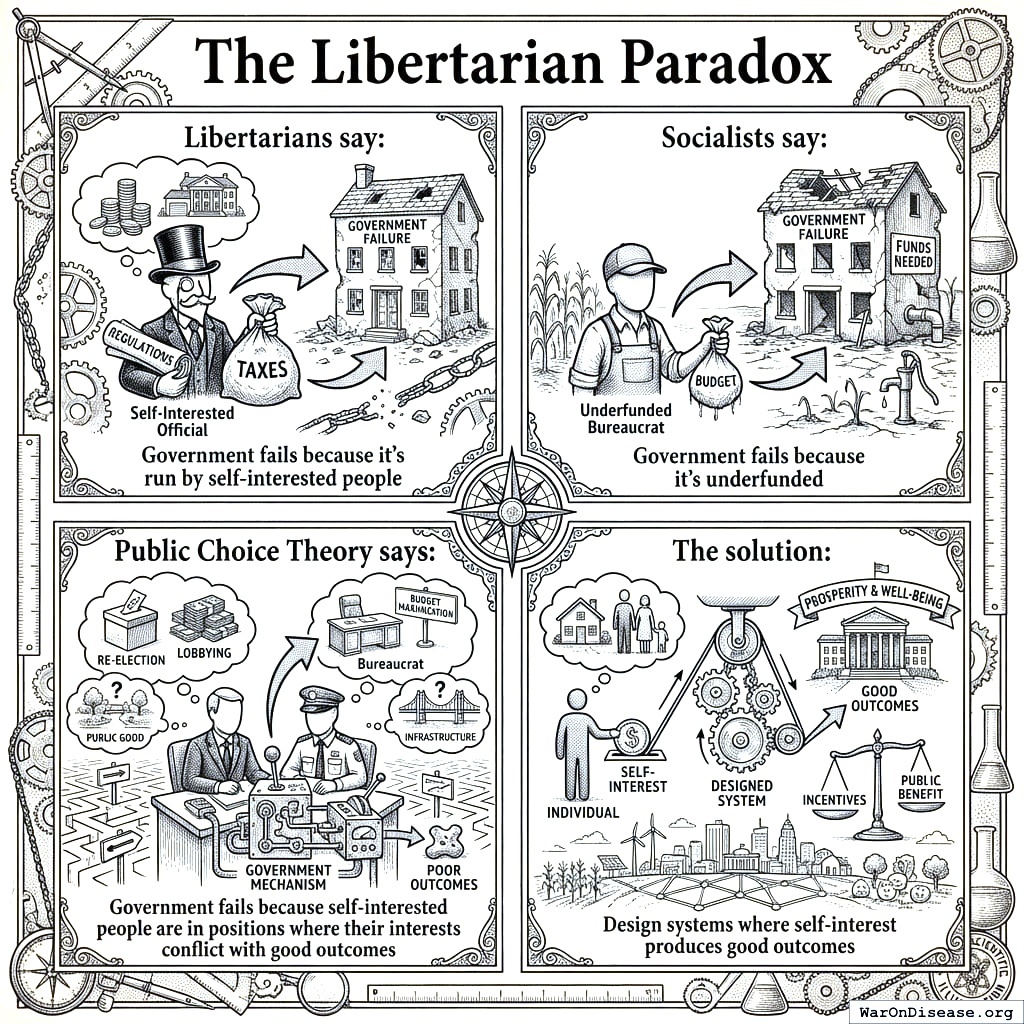
The Misdiagnosis
Every political faction on your planet has diagnosed the same problem and prescribed a different wrong solution:
Everyone agrees the government is broken. They have argued about why for two centuries while the people it was meant to help keep dying on schedule.
I attended three of your political meetings. At the first, they said the government was too big. At the second, they said the government was too small. At the third, they said the government was exactly the right size but full of the wrong species. I left with the third group. They had better snacks, and also they were correct.
The third group is called “Public Choice Theory.” Their solution: design systems where selfish behavior accidentally produces good outcomes. A rational civilization would pick this option in about 12 minutes. Your species has been arguing about the first two for several centuries. This is called “political philosophy,” which is the art of being wrong about the same thing in increasingly sophisticated ways.
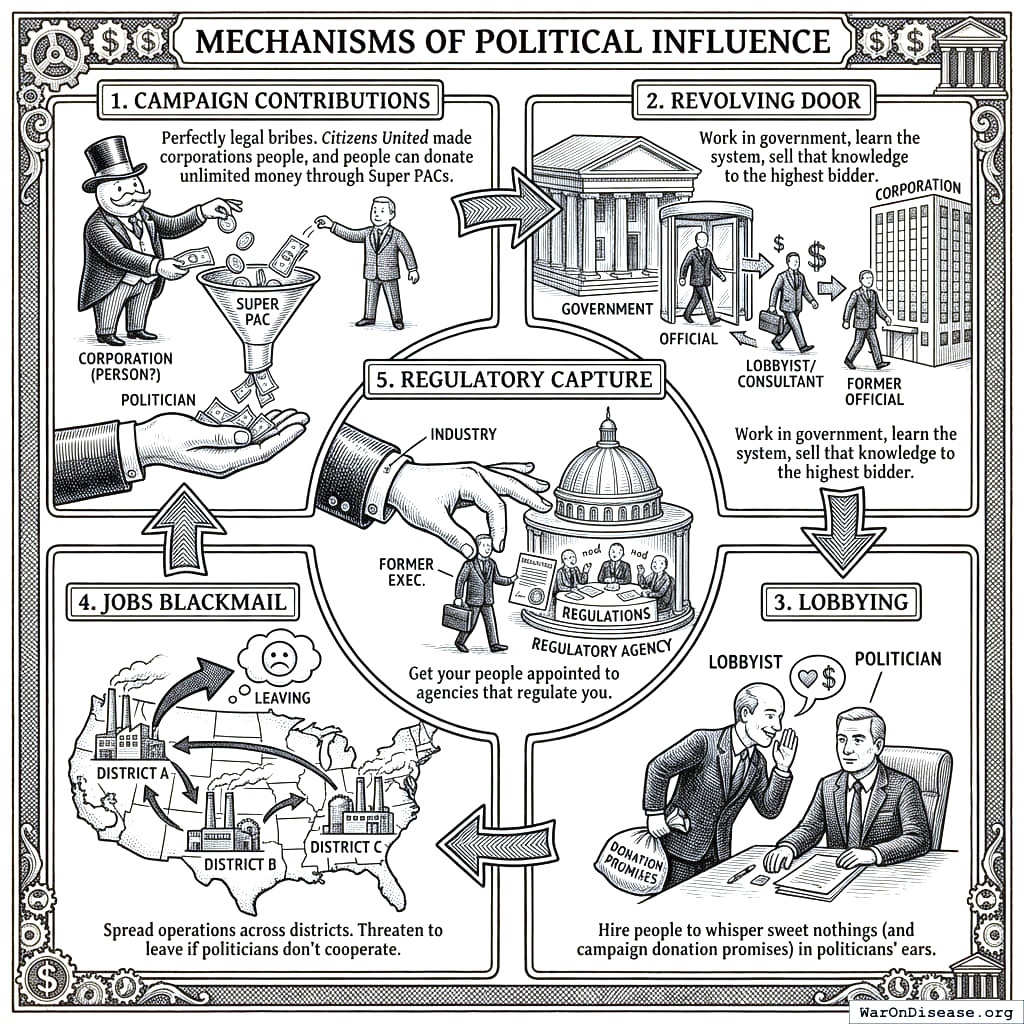
Regulatory Capture: How the Burglar Trained the Guard Dog
You hired a guard dog. Someone fed it treats. Now it guards them.
There are 13,700 registered lobbyists in Washington83. “Lobbying” literally means standing in a lobby. Your corporations spend billions of papers a year paying people to stand in hallways. People who stand in hallways are usually lost. Here, they’re the most powerful people in your government.
Half of them used to work in the government they’re now lobbying, which your species calls “a career path.” Every other profession calls it “defecting.” Corporations spend $4.4 billion (95% CI: $3.74 billion-$5.06 billion) a year on this professional persuading161. Divide that by 535 members of Congress and you get over $8 million in professional persuasion surrounding each congressman, who earns less than a mid-level dentist185.
The mystery is not that they’re influenced. The mystery is that any of them aren’t.
You hired a guard dog. Someone fed it treats. Now it guards them.
A court ruling called Citizens United186 made corporations “people” who can spend unlimited papers on elections through Super PACs (which are like normal PACs but super). Unlike you, a corporation cannot be imprisoned, embarrassed, or given cancer. It has all your rights and none of your problems. This is a good deal if you can get it. (You can’t. You’re a person.)
Pharmaceutical companies write their own regulations. The Medicare Modernization Act banned the government from negotiating drug prices187. This is why insulin that costs $6 to make costs you $300188. A 4,900% markup. I checked with your illegal drug dealers, and even they find this excessive.
The Self-Sustaining War Machine
The military-industrial complex distributes operations across 42 states189 so that cutting any program threatens jobs in enough districts to make it politically impossible. Cutting a weapons program doesn’t just lose a contract. It loses votes in 42 states simultaneously. This is not an accident. Someone designed this. (Someone good at design, wasted on murder.)
The remarkable part is not that the war industry lobbies for budgets. It’s that the war industry produces the threats that justify the budgets:
Have no enemies
Build military bases abroad
Locals resist the foreign military bases (as you would)
Resistance becomes terrorism
Terrorism justifies military budgets
Military budgets fund more bases abroad
Go to step 1 (forever)
Robert Pape at the University of Chicago found that 95% of suicide terrorist attacks from 1980 to 2003 were driven by foreign military occupation, not ideology190. Half the attackers were atheists and Marxists who couldn’t have found Mecca on a map. Your $8 trillion War on Terror191 took terrorist attacks from roughly 1,000 per year to nearly 17,000 by 2014192. You spent $8 trillion to increase the problem by 1,600%. Your species calls this “defense policy.”
Most industries merely buy favorable rules. The military industry manufactures the emergencies that make the rules seem necessary. The Pentagon has never passed an audit101. It cannot tell you where the last trillion dollars went. It is, however, very confident about needing the next one.
Pharma employs 3 lobbyists for every member of Congress193. The FDA gets 75% of its drug review budget from the companies it regulates194. That is like funding the police department with donations from the criminals. For a detailed examination of what this produces, see FDA: Unsafe and Ineffective.
The Ratchet
The ratchet only turns one way.
After WW2, the US cut military spending by 87.6% in two years155. GM went from building bombers back to building Cadillacs. The economy boomed195. It was the greatest period of broad-based prosperity in your country’s history, and it happened immediately after you stopped spending papers on killing people.
The military-industrial complex made sure that never happened again.
In inflation-adjusted dollars, peacetime spending is now 30.6x the pre-WW2 baseline: $29 billion in 1939 versus $886 billion today, in constant dollars, with no world war to justify it. The tumor grew its own blood supply and then reclassified the growth as vital organs.
The Equilibrium
Everything is working exactly as designed:
Cures are a one-time payment. Treatments are recurring revenue. They fund treatments.
Approving a bad drug ends careers. Delaying a good one ends lives, but not careers. They delay drugs.
Everyone who decides things is winning. Everyone who’s dying is not deciding things. The winners keep deciding.
The system works perfectly. It is just optimized for the wrong species.
The solution is not to elect better people. (Every civilization tries. They get eaten by the system in about 12 minutes.) The solution is to build a different system.
Pointing the Machine at Something Useful
Lobbying is just one gear. The full cost of political dysfunction (military overspend, healthcare administration, regulatory friction, tax complexity, corporate welfare, and the rest) totals $4.98 trillion (95% CI: $4.39 trillion-$5.61 trillion) per year, or 17.3% (95% CI: 15.3%-19.5%) of GDP. A forensic audit identifies $2.49 trillion (95% CI: $2.19 trillion-$2.81 trillion) in recoverable papers per year if U.S. governance merely matched the average rich country. You don’t need a revolution. You need a reallocation. Revolutions require guns. Reallocations require spreadsheets. Your species is surprisingly bad at both.
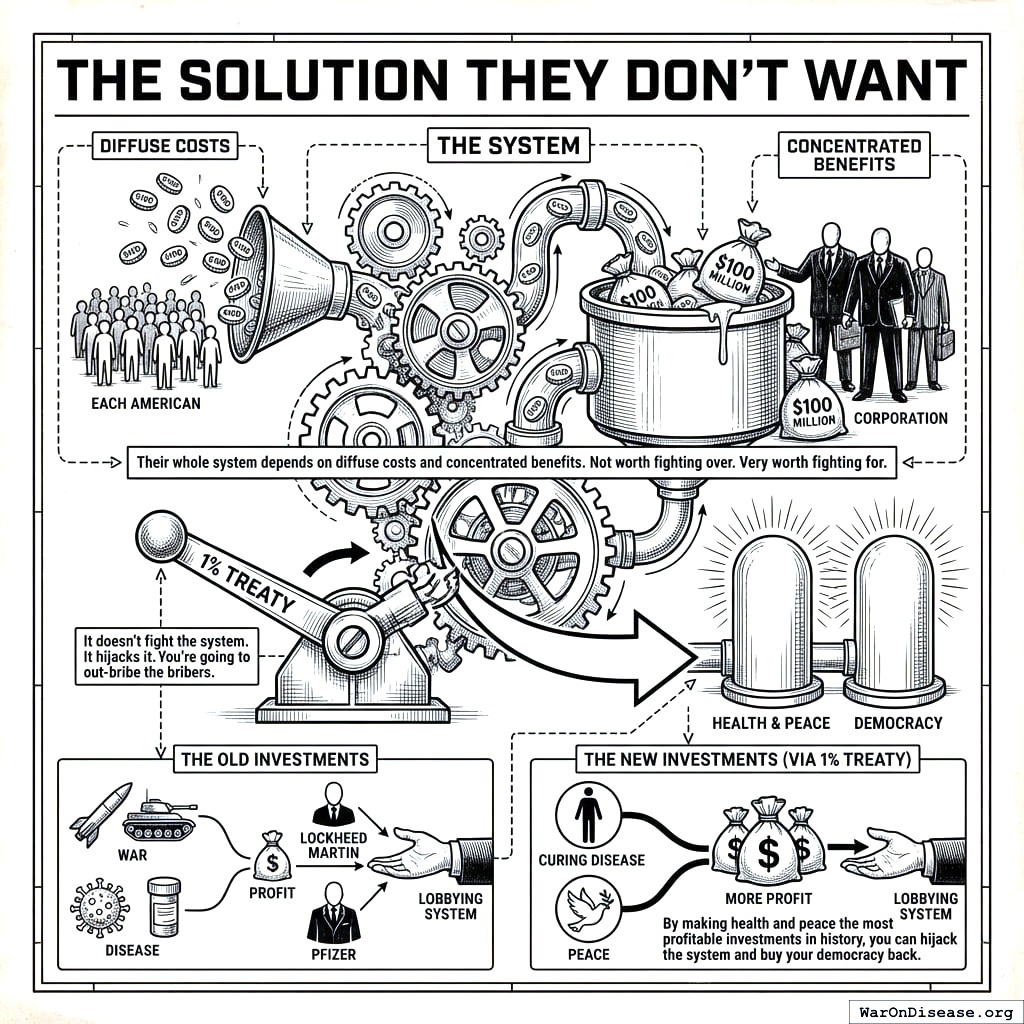
But nobody fights to recover it. Same pattern as this entire chapter: each corporation gains $100 million (worth hiring a thousand lobbyists). Each citizen loses thousands (not worth a phone call). The losses are too spread out to organize around. The gains are too concentrated to give up.
But what if curing disease was more profitable than treating it? What if peace paid better than war? What if you could point the same corruption machine at something useful?
That’s what a 1% Treaty196197 does. It redirects the papers. But redirecting papers into a system run by the same committees and lobbyists just creates a new pile for the same parasites to feed on. You need two more things.
Incentive Alignment Bonds198 turn the bribery machine against itself. Politicians who vote for the treaty get reelection papers and cushy post-office careers. Politicians who vote against it watch that same money go to their opponents. You don’t fight the corruption. You outbid it. Same machine. Same greed. Different output.
Wishocracy199 replaces the committees that lobbyists capture. Instead of 535 congressmen deciding which diseases get funded (based on who bought them dinner), 8 billion people make pairwise comparisons, and an algorithm allocates the budget. No committee chairs. No fundraising quotas. No lobbyist can bribe 8 billion random voters, and the only way to try is to offer them something they actually want (which is the system working correctly, for once).
The plan is to give the bribers more money than the other bribers are giving them, and then replace the thing they were bribing with an equation. This should take about 12 minutes to understand. It will probably take your species longer, because you will want to argue about it first.
The corruption machine, pointed at something useful for once.
1.
NIH Common Fund. NIH pragmatic trials: Minimal funding despite 30x cost advantage. NIH Common Fund: HCS Research Collaboratoryhttps://commonfund.nih.gov/hcscollaboratory (2025)
The NIH Pragmatic Trials Collaboratory funds trials at $500K for planning phase, $1M/year for implementation-a tiny fraction of NIH’s budget. The ADAPTABLE trial cost $14 million for 15,076 patients (= $929/patient) versus $420 million for a similar traditional RCT (30x cheaper), yet pragmatic trials remain severely underfunded. PCORnet infrastructure enables real-world trials embedded in healthcare systems, but receives minimal support compared to basic research funding. Additional sources: https://commonfund.nih.gov/hcscollaboratory | https://pcornet.org/wp-content/uploads/2025/08/ADAPTABLE_Lay_Summary_21JUL2025.pdf | https://www.ncbi.nlm.nih.gov/pmc/articles/PMC5604499/
Chance of American dying in foreign-born terrorist attack: 1 in 3.6 million per year (1975-2015) Including 9/11 deaths; annual murder rate is 253x higher than terrorism death rate More likely to die from lightning strike than foreign terrorism Note: Comprehensive 41-year study shows terrorism risk is extremely low compared to everyday dangers Additional sources: https://www.cato.org/policy-analysis/terrorism-immigration-risk-analysis | https://www.nbcnews.com/news/us-news/you-re-more-likely-die-choking-be-killed-foreign-terrorists-n715141
Mean exclusion rate: 86.1% across 158 antidepressant efficacy trials (range: 44.4% to 99.8%) More than 82% of real-world depression patients would be ineligible for antidepressant registration trials Exclusion rates increased over time: 91.4% (2010-2014) vs. 83.8% (1995-2009) Most common exclusions: comorbid psychiatric disorders, age restrictions, insufficient depression severity, medical conditions Emergency psychiatry patients: only 3.3% eligible (96.7% excluded) when applying 9 common exclusion criteria Only a minority of depressed patients seen in clinical practice are likely to be eligible for most AETs Note: Generalizability of antidepressant trials has decreased over time, with increasingly stringent exclusion criteria eliminating patients who would actually use the drugs in clinical practice Additional sources: https://pubmed.ncbi.nlm.nih.gov/26276679/ | https://pubmed.ncbi.nlm.nih.gov/26164052/ | https://www.wolterskluwer.com/en/news/antidepressant-trials-exclude-most-real-world-patients-with-depression
Berkshire’s compounded annual return from 1965 through 2024 was 19.9%, nearly double the 10.4% recorded by the S&P 500. Berkshire shares skyrocketed 5,502,284% compared to the S&P 500’s 39,054% rise during that period. Additional sources: https://www.cnbc.com/2025/05/05/warren-buffetts-return-tally-after-60-years-5502284percent.html | https://www.slickcharts.com/berkshire-hathaway/returns
Comprehensive mortality and morbidity data by cause, age, sex, country, and year Global mortality: 55-60 million deaths annually Lives saved by modern medicine (vaccines, cardiovascular drugs, oncology): 12M annually (conservative aggregate) Leading causes of death: Cardiovascular disease (17.9M), Cancer (10.3M), Respiratory disease (4.0M) Note: Baseline data for regulatory mortality analysis. Conservative estimate of pharmaceutical impact based on WHO immunization data (4.5M/year from vaccines) + cardiovascular interventions (3.3M/year) + oncology (1.5M/year) + other therapies. Additional sources: https://www.who.int/data/gho/data/themes/mortality-and-global-health-estimates
General range: $3,000-$5,500 per life saved (GiveWell top charities) Helen Keller International (Vitamin A): $3,500 average (2022-2024); varies $1,000-$8,500 by country Against Malaria Foundation: $5,500 per life saved New Incentives (vaccination incentives): $4,500 per life saved Malaria Consortium (seasonal malaria chemoprevention): $3,500 per life saved VAS program details: $2 to provide vitamin A supplements to child for one year Note: Figures accurate for 2024. Helen Keller VAS program has wide country variation ($1K-$8.5K) but $3,500 is accurate average. Among most cost-effective interventions globally Additional sources: https://www.givewell.org/charities/top-charities | https://www.givewell.org/charities/helen-keller-international | https://ourworldindata.org/cost-effectiveness
The cost of 5.56mm NATO ammunition at military bulk procurement rates is approximately $0.40 per round, based on Lake City Army Ammunition Plant production and commercial market floor prices for mil-spec M855 ammunition.
The General Accounting Office reports that US forces used 1.8 billion rounds of small-arms ammunition per year, a level that more than doubled in five years. An estimated 250,000 rounds were fired for every insurgent killed in Iraq and Afghanistan.
Average family caregiver: 25-26 hours per week (100-104 hours per month) 38 million caregivers providing 36 billion hours of care annually Economic value: $16.59 per hour = $600 billion total annual value (2021) 28% of people provided eldercare on a given day, averaging 3.9 hours when providing care Caregivers living with care recipient: 37.4 hours per week Caregivers not living with recipient: 23.7 hours per week Note: Disease-related caregiving is subset of total; includes elderly care, disability care, and child care Additional sources: https://www.aarp.org/caregiving/financial-legal/info-2023/unpaid-caregivers-provide-billions-in-care.html | https://www.bls.gov/news.release/elcare.nr0.htm | https://www.caregiver.org/resource/caregiver-statistics-demographics/
Forbes identified a record 2,781 billionaires worldwide with combined net worth of $14.2 trillion, 141 more than 2023. Bernard Arnault (LVMH) topped the list at $233 billion.
US programs (1994-2023): $540B direct savings, $2.7T societal savings ( $18B/year direct, $90B/year societal) Global (2001-2020): $820B value for 10 diseases in 73 countries ( $41B/year) ROI: $11 return per $1 invested Measles vaccination alone saved 93.7M lives (61% of 154M total) over 50 years (1974-2024) Additional sources: https://www.cdc.gov/mmwr/volumes/73/wr/mm7331a2.htm | https://www.thelancet.com/journals/lancet/article/PIIS0140-6736(24)00850-X/fulltext
CPI-U (1980): 82.4 CPI-U (2024): 313.5 Inflation multiplier (1980-2024): 3.80× Cumulative inflation: 280.48% Average annual inflation rate: 3.08% Note: Official U.S. government inflation data using Consumer Price Index for All Urban Consumers (CPI-U). Additional sources: https://www.bls.gov/data/inflation_calculator.htm
Explores the aggregation of information in groups, arguing that decisions are often better than could have been made by any single member of the group. The opening anecdote relates Francis Galton’s surprise that the crowd at a county fair accurately guessed the weight of an ox when the median of their individual guesses was taken. The three conditions for a group to be intelligent are diversity, independence, and decentralization. Additional sources: https://archive.org/details/wisdomofcrowds0000suro | https://en.wikipedia.org/wiki/The_Wisdom_of_Crowds | https://www.amazon.com/Wisdom-Crowds-James-Surowiecki/dp/0385721706
.
18.
ClinicalTrials.gov API v2 direct analysis. ClinicalTrials.gov cumulative enrollment data (2025). Direct analysis via ClinicalTrials.gov API v2https://clinicaltrials.gov/data-api/api
Analysis of 100,000 active/recruiting/completed trials on ClinicalTrials.gov (as of January 2025) shows cumulative enrollment of 12.2 million participants: Phase 1 (722k), Phase 2 (2.2M), Phase 3 (6.5M), Phase 4 (2.7M). Median participants per trial: Phase 1 (33), Phase 2 (60), Phase 3 (237), Phase 4 (90). Additional sources: https://clinicaltrials.gov/data-api/api
Only 3-5% of adult cancer patients in US receive treatment within clinical trials About 5% of American adults have ever participated in any clinical trial Oncology: 2-3% of all oncology patients participate Contrast: 50-60% enrollment for pediatric cancer trials (<15 years old) Note: 20% of cancer trials fail due to insufficient enrollment; 11% of research sites enroll zero patients Additional sources: https://www.fightcancer.org/policy-resources/barriers-patient-enrollment-therapeutic-clinical-trials-cancer | https://hints.cancer.gov/docs/Briefs/HINTS_Brief_48.pdf
2.3 billion individuals had more than five ailments (2013) Chronic conditions caused 74% of all deaths worldwide (2019), up from 67% (2010) Approximately 1 in 3 adults suffer from multiple chronic conditions (MCCs) Risk factor exposures: 2B exposed to biomass fuel, 1B to air pollution, 1B smokers Projected economic cost: $47 trillion by 2030 Note: 2.3B with 5+ ailments is more accurate than "2B with chronic disease." One-third of all adults globally have multiple chronic conditions Additional sources: https://www.sciencedaily.com/releases/2015/06/150608081753.htm | https://pmc.ncbi.nlm.nih.gov/articles/PMC10830426/ | https://pmc.ncbi.nlm.nih.gov/articles/PMC6214883/
Approximately 12% of trials with results posted on the ClinicalTrials.gov results database (905/7,646) were terminated. Primary reasons: insufficient accrual (57% of non-data-driven terminations), business/strategic reasons, and efficacy/toxicity findings (21% data-driven terminations).
Global clinical trials market valued at approximately $83 billion in 2024, with projections to reach $83-132 billion by 2030. Additional sources: https://www.globenewswire.com/news-release/2024/04/19/2866012/0/en/Global-Clinical-Trials-Market-Research-Report-2024-An-83-16-Billion-Market-by-2030-AI-Machine-Learning-and-Blockchain-will-Transform-the-Clinical-Trials-Landscape.html | https://www.precedenceresearch.com/clinical-trials-market
Military sector federal lobbying totaled $198,009,793 in 2025, up from $159.5 million in 2024 and $142.9 million in 2023. Additional sources: https://www.opensecrets.org/federal-lobbying/sectors/summary?id=D
BAE Systems market capitalization approx $75.80B and Thales approx $56.68B as of June 2026, combined approx $132.5B for the two major allied European military primes. Additional sources: https://companiesmarketcap.com/thales/marketcap/
Combined market capitalization of 11 US military primes approx $835.8B at the 2026-06-11 close: RTX $248.07B, Boeing $174.71B, Lockheed Martin $126.51B, General Dynamics $96.90B, Northrop Grumman $78.48B, L3Harris $58.16B, Leidos $15.36B, Huntington Ingalls $11.86B, CACI $11.61B, Booz Allen Hamilton $9.24B, SAIC $4.86B. Tradeable float across the 13 Western primes (adding BAE Systems and Thales) approx $880B, about 91 percent of combined cap (range $850-900B), from per-company float and shares-outstanding statistics pages; big-5 floats verified individually (RTX 92.6%, BA 96.0%, LMT 85.7%, GD 94.2%, NOC 99.7%); Thales is the outlier at approx 45% float because the French State (26.60%) and Dassault Aviation (26.59%) stakes are locked. Additional sources: https://stockanalysis.com/stocks/rtx/statistics/ | https://www.dassault-aviation.com/en/group/about-us/shareholding-structure-and-organization-chart/
Political scientist R.J. Rummel’s comprehensive accounting of democide (government murder of unarmed civilians) in the 20th century. His final revised estimate: 262 million people murdered by their own governments from 1900-1999, excluding battle deaths in wars. Range: 200-272+ million. Communist regimes account for the largest share (100-148+ million). Updated figures at hawaii.edu/powerkills.
Schistosomiasis treatment: $28.19-$70.48 per DALY (using arithmetic means with varying disability weights) Soil-transmitted helminths (STH) treatment: $82.54 per DALY (midpoint estimate) Note: GiveWell explicitly states this 2011 analysis is "out of date" and their current methodology focuses on long-term income effects rather than short-term health DALYs Additional sources: https://www.givewell.org/international/technical/programs/deworming/cost-effectiveness
.
30.
Calculated from IHME Global Burden of Disease (2.55B DALYs) and global GDP per capita valuation. $109 trillion annual global disease burden.
The global economic burden of disease, including direct healthcare costs ($8.2 trillion) and lost productivity ($100.9 trillion from 2.55 billion DALYs × $39,570 per DALY), totals approximately $109.1 trillion annually.
Phase I duration: 2.3 years average Total time to market (Phase I-III + approval): 10.5 years average Phase transition success rates: Phase I→II: 63.2%, Phase II→III: 30.7%, Phase III→Approval: 58.1% Overall probability of approval from Phase I: 12% Note: Largest publicly available study of clinical trial success rates. Efficacy lag = 10.5 - 2.3 = 8.2 years post-safety verification. Additional sources: https://go.bio.org/rs/490-EHZ-999/images/ClinicalDevelopmentSuccessRates2011_2020.pdf
Approximately 30% of drugs gain at least one new indication after initial approval. Additional sources: https://www.nature.com/articles/s41591-024-03233-x
Early childhood education: Benefits 12X outlays by 2050; $8.70 per dollar over lifetime Educational facilities: $1 spent → $1.50 economic returns Energy efficiency comparison: 2-to-1 benefit-to-cost ratio (McKinsey) Private return to schooling: 9% per additional year (World Bank meta-analysis) Note: 2.1 multiplier aligns with benefit-to-cost ratios for educational infrastructure/energy efficiency. Early childhood education shows much higher returns (12X by 2050) Additional sources: https://www.epi.org/publication/bp348-public-investments-outside-core-infrastructure/ | https://documents1.worldbank.org/curated/en/442521523465644318/pdf/WPS8402.pdf | https://freopp.org/whitepapers/establishing-a-practical-return-on-investment-framework-for-education-and-skills-development-to-expand-economic-opportunity/
Infrastructure fiscal multiplier: 1.6 during contractionary phase of economic cycle Average across all economic states: 1.5 (meaning $1 of public investment → $1.50 of economic activity) Time horizon: 0.8 within 1 year, 1.5 within 2-5 years Range of estimates: 1.5-2.0 (following 2008 financial crisis & American Recovery Act) Italian public construction: 1.5-1.9 multiplier US ARRA: 0.4-2.2 range (differential impacts by program type) Economic Policy Institute: Uses 1.6 for infrastructure spending (middle range of estimates) Note: Public investment less likely to crowd out private activity during recessions; particularly effective when monetary policy loose with near-zero rates Additional sources: https://blogs.worldbank.org/en/ppps/effectiveness-infrastructure-investment-fiscal-stimulus-what-weve-learned | https://www.gihub.org/infrastructure-monitor/insights/fiscal-multiplier-effect-of-infrastructure-investment/ | https://cepr.org/voxeu/columns/government-investment-and-fiscal-stimulus | https://www.richmondfed.org/publications/research/economic_brief/2022/eb_22-04
Ramey (2011): 0.6 short-run multiplier Barro (1981): 0.6 multiplier for WWII spending (war spending crowded out 40¢ private economic activity per federal dollar) Barro & Redlick (2011): 0.4 within current year, 0.6 over two years; increased govt spending reduces private-sector GDP portions General finding: $1 increase in deficit-financed federal military spending = less than $1 increase in GDP Variation by context: Central/Eastern European NATO: 0.6 on impact, 1.5-1.6 in years 2-3, gradual fall to zero Ramey & Zubairy (2018): Cumulative 1% GDP increase in military expenditure raises GDP by 0.7% Additional sources: https://www.mercatus.org/research/research-papers/defense-spending-and-economy | https://cepr.org/voxeu/columns/world-war-ii-america-spending-deficits-multipliers-and-sacrifice | https://www.rand.org/content/dam/rand/pubs/research_reports/RRA700/RRA739-2/RAND_RRA739-2.pdf
The FDA GRAS (Generally Recognized as Safe) list contains approximately 570–700 substances. Additional sources: https://www.fda.gov/food/generally-recognized-safe-gras/gras-notice-inventory
2024: 233,597 deaths (30% increase from 179,099 in 2023) Deadliest conflicts: Ukraine (67,000), Palestine (35,000) Nearly 200,000 acts of violence (25% higher than 2023, double from 5 years ago) One in six people globally live in conflict-affected areas Additional sources: https://acleddata.com/2024/12/12/data-shows-global-conflict-surged-in-2024-the-washington-post/ | https://acleddata.com/media-citation/data-shows-global-conflict-surged-2024-washington-post | https://acleddata.com/conflict-index/index-january-2024/
.
44.
UCDP. State violence deaths annually. UCDP: Uppsala Conflict Data Programhttps://ucdp.uu.se/
Uppsala Conflict Data Program (UCDP): Tracks one-sided violence (organized actors attacking unarmed civilians) UCDP definition: Conflicts causing at least 25 battle-related deaths in calendar year 2023 total organized violence: 154,000 deaths; Non-state conflicts: 20,900 deaths UCDP collects data on state-based conflicts, non-state conflicts, and one-sided violence Specific "2,700 annually" figure for state violence not found in recent UCDP data; actual figures vary annually Additional sources: https://ucdp.uu.se/ | https://en.wikipedia.org/wiki/Uppsala_Conflict_Data_Program | https://ourworldindata.org/grapher/deaths-in-armed-conflicts-by-region
2023: 8,352 deaths (22% increase from 2022, highest since 2017) 2023: 3,350 terrorist incidents (22% decrease), but 56% increase in avg deaths per attack Global Terrorism Database (GTD): 200,000+ terrorist attacks recorded (2021 version) Maintained by: National Consortium for Study of Terrorism & Responses to Terrorism (START), U. of Maryland Geographic shift: Epicenter moved from Middle East to Central Sahel (sub-Saharan Africa) - now >50% of all deaths Additional sources: https://ourworldindata.org/terrorism | https://reliefweb.int/report/world/global-terrorism-index-2024 | https://www.start.umd.edu/gtd/ | https://ourworldindata.org/grapher/fatalities-from-terrorism
.
46.
Institute for Health Metrics and Evaluation (IHME). IHME global burden of disease 2021 (2.88B DALYs, 1.13B YLD). Institute for Health Metrics and Evaluation (IHME)https://vizhub.healthdata.org/gbd-results/ (2024)
In 2021, global DALYs totaled approximately 2.88 billion, comprising 1.75 billion Years of Life Lost (YLL) and 1.13 billion Years Lived with Disability (YLD). This represents a 13% increase from 2019 (2.55B DALYs), largely attributable to COVID-19 deaths and aging populations. YLD accounts for approximately 39% of total DALYs, reflecting the substantial burden of non-fatal chronic conditions. Additional sources: https://vizhub.healthdata.org/gbd-results/ | https://www.thelancet.com/journals/lancet/article/PIIS0140-6736(24)00757-8/fulltext | https://www.healthdata.org/research-analysis/about-gbd
War on Terror emissions: 1.2B metric tons GHG (equivalent to 257M cars/year) Military: 5.5% of global GHG emissions (2X aviation + shipping combined) US DoD: World’s single largest institutional oil consumer, 47th largest emitter if nation Cleanup costs: $500B+ for military contaminated sites Gaza war environmental damage: $56.4B; landmine clearance: $34.6B expected Climate finance gap: Rich nations spend 30X more on military than climate finance Note: Military activities cause massive environmental damage through GHG emissions, toxic contamination, and long-term cleanup costs far exceeding current climate finance commitments Additional sources: https://watson.brown.edu/costsofwar/costs/social/environment | https://earth.org/environmental-costs-of-wars/ | https://transformdefence.org/transformdefence/stats/
Global military spending: $2.7 trillion (2024, SIPRI) Global government medical research: $68 billion (2024) Actual ratio: 39.7:1 in favor of weapons over medical research Military R&D alone: $85B (2004 data, 10% of global R&D) Military spending increases crowd out health: 1% ↑ military = 0.62% ↓ health spending Note: Ratio actually worse than 36:1. Each 1% increase in military spending reduces health spending by 0.62%, with effect more intense in poorer countries (0.962% reduction) Additional sources: https://www.sipri.org/commentary/blog/2016/opportunity-cost-world-military-spending | https://pmc.ncbi.nlm.nih.gov/articles/PMC9174441/ | https://www.congress.gov/crs-product/R45403
Lost human capital from war: $300B annually (economic impact of losing skilled/productive individuals to conflict) Broader conflict/violence cost: $14T/year globally 1.4M violent deaths/year; conflict holds back economic development, causes instability, widens inequality, erodes human capital 2002: 48.4M DALYs lost from 1.6M violence deaths = $151B economic value (2000 USD) Economic toll includes: commodity prices, inflation, supply chain disruption, declining output, lost human capital Additional sources: https://thinkbynumbers.org/military/war/the-economic-case-for-peace-a-comprehensive-financial-analysis/ | https://www.weforum.org/stories/2021/02/war-violence-costs-each-human-5-a-day/ | https://pubmed.ncbi.nlm.nih.gov/19115548/
PTSD economic burden (2018 U.S.): $232.2B total ($189.5B civilian, $42.7B military) Civilian costs driven by: Direct healthcare ($66B), unemployment ($42.7B) Military costs driven by: Disability ($17.8B), direct healthcare ($10.1B) Exceeds costs of other mental health conditions (anxiety, depression) War-exposed populations: 2-3X higher rates of anxiety, depression, PTSD; women and children most vulnerable Note: Actual burden $232B, significantly higher than "$100B" claimed Additional sources: https://pubmed.ncbi.nlm.nih.gov/35485933/ | https://news.va.gov/103611/study-national-economic-burden-of-ptsd-staggering/ | https://pmc.ncbi.nlm.nih.gov/articles/PMC9957523/
The average cost of supporting a refugee is $1,384 per year. This represents total host country costs (housing, healthcare, education, security). OECD countries average $6,100 per refugee (mean 2022-2023), with developing countries spending $700-1,000. Global weighted average of $1,384 is reasonable given that 75-85% of refugees are in low/middle-income countries. Additional sources: https://www.cgdev.org/blog/costs-hosting-refugees-oecd-countries-and-why-uk-outlier | https://www.unhcr.org/sites/default/files/2024-11/UNHCR-WB-global-cost-of-refugee-inclusion-in-host-country-health-systems.pdf
Estimated $616B annual cost from conflict-related trade disruption. World Bank research shows civil war costs an average developing country 30 years of GDP growth, with 20 years needed for trade to return to pre-war levels. Trade disputes analysis shows tariff escalation could reduce global exports by up to $674 billion. Additional sources: https://www.worldbank.org/en/topic/trade/publication/trading-away-from-conflict | https://www.nber.org/papers/w11565 | http://blogs.worldbank.org/en/trade/impacts-global-trade-and-income-current-trade-disputes
Global days of therapy reached 1.8 trillion in 2019 (234 defined daily doses per person). Diabetes, respiratory, CVD, and cancer account for 71 percent of medicine use. Projected to reach 3.8 trillion DDDs by 2028.
Estimated private pharmaceutical and biotech clinical trial spending is approximately $75-90 billion annually, representing roughly 90% of global clinical trial spending.
Global cybercrime costs: $3T (2015) → $6T (2021) → $10.5T (2025 projected) 15% annual growth rate If measured as country, would be 3rd largest economy after US and China Greatest transfer of economic wealth in history Note: More profitable than global trade of all major illegal drugs combined. Includes data theft, productivity loss, IP theft, fraud Additional sources: <https://cybersecurityventures.com/hackerpocalypse-cybercrime-report-2016/> | https://www.boisestate.edu/cybersecurity/2022/06/16/cybercrime-to-cost-the-world-10-5-trillion-annually-by-2025/
Quantifying the gap between current global governance and theoretical maximum welfare, estimating a 31-53% efficiency score and $97 trillion in annual opportunity costs.
Historical GDP per capita estimates from year 1 to present. Global GDP per capita in 1900: approximately 1,260 in 1990 international dollars (roughly 3,150 in 2024 USD after PPP and inflation adjustment). Standard reference for long-run comparative economic history.
Estimated range based on NIH ( $0.8-5.6B), NIHR ($1.6B total budget), and EU funding ( $1.3B/year). Roughly 5-10% of global market. Additional sources: https://www.appliedclinicaltrialsonline.com/view/sizing-clinical-research-market | https://www.thelancet.com/journals/langlo/article/PIIS2214-109X(20)30357-0/fulltext
Total global household wealth: USD 454.4 trillion (2022) Wealth declined by USD 11.3 trillion (-2.4%) in 2022, first decline since 2008 Wealth per adult: USD 84,718 Additional sources: https://www.ubs.com/global/en/family-office-uhnw/reports/global-wealth-report-2023.html
The 2024 Revision of the World Population Prospects provides population estimates and projections for 237 countries or areas. Global median age approximately 30.5 years in 2024, reflecting population-weighted average across all regions.
Estimated from major foundation budgets and activities. Nonprofit clinical trial funding estimate.
Nonprofit foundations spend an estimated $2-5 billion annually on clinical trials globally, representing approximately 2-5% of total clinical trial spending.
2024: >$100 billion ($190,151/minute) - 11% increase ($9.9B) from 2023 Nine nuclear-armed states: China, France, India, Israel, N. Korea, Pakistan, Russia, UK, US US: $56.8B (more than all other 8 states combined); China: $12.5B; UK: $10B (+26% YoY, biggest increase) Historical trend: $72.9B (2019) → $82.4B (2021) → >$100B (2024) Private sector contracts: $463B ongoing; $42.5B earned from contracts in 2024 alone Note: $100B/year figure accurate for 2024. Rapid growth from $73B (2019). US spends more than rest of world combined on nuclear weapons Additional sources: https://www.icanw.org/global_spending_on_nuclear_weapons_topped_100_billion_in_2024 | https://www.icanw.org/the_cost_of_nuclear_weapons
.
70.
Industry reports: IQVIA. Global pharmaceutical r&d spending.
Total global pharmaceutical R&D spending is approximately $300 billion annually. Clinical trials represent 15-20% of this total ($45-60B), with the remainder going to drug discovery, preclinical research, regulatory affairs, and manufacturing development.
Milestone: November 15, 2022 (UN World Population Prospects 2022) Day of Eight Billion" designated by UN Added 1 billion people in just 11 years (2011-2022) Growth rate: Slowest since 1950; fell under 1% in 2020 Future: 15 years to reach 9B (2037); projected peak 10.4B in 2080s Projections: 8.5B (2030), 9.7B (2050), 10.4B (2080-2100 plateau) Note: Milestone reached Nov 2022. Population growth slowing; will take longer to add next billion (15 years vs 11 years) Additional sources: https://www.un.org/en/desa/world-population-reach-8-billion-15-november-2022 | https://www.un.org/en/dayof8billion | https://en.wikipedia.org/wiki/Day_of_Eight_Billion
The research found that nonviolent campaigns were twice as likely to succeed as violent ones, and once 3.5% of the population were involved, they were always successful. Chenoweth and Maria Stephan studied the success rates of civil resistance efforts from 1900 to 2006, finding that nonviolent movements attracted, on average, four times as many participants as violent movements and were more likely to succeed. Key finding: Every campaign that mobilized at least 3.5% of the population in sustained protest was successful (in their 1900-2006 dataset) Note: The 3.5% figure is a descriptive statistic from historical analysis, not a guaranteed threshold. One exception (Bahrain 2011-2014 with 6%+ participation) has been identified. The rule applies to regime change, not policy change in democracies. Additional sources: https://www.hks.harvard.edu/centers/carr/publications/35-rule-how-small-minority-can-change-world | https://www.hks.harvard.edu/sites/default/files/2024-05/Erica%20Chenoweth_2020-005.pdf | https://www.bbc.com/future/article/20190513-it-only-takes-35-of-people-to-change-the-world | https://en.wikipedia.org/wiki/3.5%25_rule
Best current register-based estimate of global registered voters. Sum of the latest available country-level Registration counts in International IDEA’s world export on 2026-04-22 = 4,128,142,495 registered voters across 199 countries and political entities. Methodology notes that Registration is the number of names on the voters’ register as reported by electoral management bodies, and comparability is imperfect because voter rolls and registration systems differ across countries. Additional sources: https://www.idea.int/data-tools/data/voter-turnout-database | https://www.idea.int/data-tools/export?type=region_only&themeId=293&world=all&loc=home
As of early 2025, we estimate that the world’s nine nuclear-armed states possess a combined total of approximately 12,241 nuclear warheads. Additional sources: https://fas.org/issues/nuclear-weapons/status-world-nuclear-forces/
Sector ranks and per-company federal lobbying spending for 2025. Combined market capitalization of the top-5 publicly traded US lobbying spenders in each government-controlling sector: pharmaceuticals $1,794.7B; technology $13,279.5B; insurance $385.6B; oil and gas $1,246.9B; four-sector total approx $16.71T. Caveats: Meta (Zuckerberg holds 60.8% of voting power) and Alphabet (Page and Brin hold 52.3%) cannot be majority-acquired; Ellison owns 40.6% of Oracle; the largest insurance lobbyists are mutuals with no public shares; trade associations (PhRMA, AHIP, SIFMA, API) are not acquirable. Additional sources: https://stockanalysis.com/stocks/
Your DNA is 3 billion base pairs Read the entire code (Human Genome Project, completed 2003) Learned to edit it (CRISPR, discovered 2012) Additional sources: https://www.genome.gov/11006929/2003-release-international-consortium-completes-hgp | https://www.nobelprize.org/prizes/chemistry/2020/press-release/
Mapping 350,000+ clinical trials showed that only 12% of the human interactome has ever been targeted by drugs. Additional sources: https://pmc.ncbi.nlm.nih.gov/articles/PMC10749231/
The ICD-10 classification contains approximately 14,000 codes for diseases, signs and symptoms. Additional sources: https://icd.who.int/browse10/2019/en
Leaded gasoline, used in the US from 1923 until its on-road ban in 1996, exposed more than half of the 2015 US population to adverse blood-lead levels in early childhood. The authors estimate childhood lead exposure cost the population a cumulative 824 million IQ points, an average of 2.6 points per person, rising to 5.9 points for the most-exposed 1966-1970 birth cohort.
Longevity escape velocity: Hypothetical point where medical advances extend life expectancy faster than time passes Term coined by Aubrey de Grey (biogerontologist) in 2004 paper; concept from David Gobel (Methuselah Foundation) Current progress: Science adds 3 months to lifespan per year; LEV requires adding >1 year per year Sinclair (Harvard): "There is no biological upper limit to age" - first person to live to 150 may already be born De Grey: 50% chance of reaching LEV by mid-to-late 2030s; SENS approach = damage repair rather than slowing damage Kurzweil (2024): LEV by 2029-2035, AI will simulate biological processes to accelerate solutions George Church: LEV "in a decade or two" via age-reversal clinical trials Natural lifespan cap: 120-150 years (Jeanne Calment record: 122); engineering approach could bypass via damage repair Key mechanisms: Epigenetic reprogramming, senolytic drugs, stem cell therapy, gene therapy, AI-driven drug discovery Current record: Jeanne Calment (122 years, 164 days) - record unbroken since 1997 Note: LEV is theoretical but increasingly plausible given demonstrated age reversal in mice (109% lifespan extension) and human cells (30-year epigenetic age reversal) Additional sources: https://en.wikipedia.org/wiki/Longevity_escape_velocity | https://pmc.ncbi.nlm.nih.gov/articles/PMC423155/ | https://www.popularmechanics.com/science/a36712084/can-science-cure-death-longevity/ | https://www.diamandis.com/blog/longevity-escape-velocity
Registered lobbyists: Over 12,000 (some estimates); 12,281 registered (2013) Former government employees as lobbyists: 2,200+ former federal employees (1998-2004), including 273 former White House staffers, 250 former Congress members & agency heads Congressional revolving door: 43% (86 of 198) lawmakers who left 1998-2004 became lobbyists; currently 59% leaving to private sector work for lobbying/consulting firms/trade groups Executive branch: 8% were registered lobbyists at some point before/after government service Additional sources: https://en.wikipedia.org/wiki/Lobbying_in_the_United_States | https://www.opensecrets.org/revolving-door | https://www.citizen.org/article/revolving-congress/ | https://www.propublica.org/article/we-found-a-staggering-281-lobbyists-whove-worked-in-the-trump-administration
Single measles vaccination: 167:1 benefit-cost ratio. MMR (measles-mumps-rubella) vaccination: 14:1 ROI. Historical US elimination efforts (1966-1974): benefit-cost ratio of 10.3:1 with net benefits exceeding USD 1.1 billion (1972 dollars, or USD 8.0 billion in 2023 dollars). 2-dose MMR programs show direct benefit/cost ratio of 14.2 with net savings of $5.3 billion, and 26.0 from societal perspectives with net savings of $11.6 billion. Additional sources: https://www.mdpi.com/2076-393X/12/11/1210 | https://www.tandfonline.com/doi/full/10.1080/14760584.2024.2367451
U.S. Government Accountability Office. Electronic Health Records: First Year of CMS’s Incentive Programs Shows Opportunities to Improve Processes to Verify Providers Met Requirements. https://www.gao.gov/products/gao-12-481 (2012).
One in four people in the world will be affected by mental or neurological disorders at some point in their lives, representing [approximately] 30% of the global burden of disease. Additional sources: https://www.who.int/news/item/28-09-2001-the-world-health-report-2001-mental-disorders-affect-one-in-four-people
IQ was significant at the 95% level in 99.8% of 1,330 BACE growth regressions. A 1 point increase in a nation’s average IQ is associated with a persistent 0.11% annual increase in GDP per capita.
Under the current system, approximately 10-15 diseases per year receive their FIRST effective treatment. Calculation: 5% of 7,000 rare diseases ( 350) have FDA-approved treatment, accumulated over 40 years of the Orphan Drug Act = 9 rare diseases/year. Adding 5-10 non-rare diseases that get first treatments yields 10-20 total. FDA approves 50 drugs/year, but many are for diseases that already have treatments (me-too drugs, second-line therapies). Only 15 represent truly FIRST treatments for previously untreatable conditions.
The budget total of $47.7 billion also includes $1.412 billion derived from PHS Evaluation financing... Additional sources: https://www.nih.gov/about-nih/organization/budget | https://officeofbudget.od.nih.gov/
Typical cost-effectiveness thresholds for medical interventions in rich countries range from $50,000 to $150,000 per QALY. The Institute for Clinical and Economic Review (ICER) uses a $100,000-$150,000/QALY threshold for value-based pricing. Between 1990-2021, authors increasingly cited $100,000 (47% by 2020-21) or $150,000 (24% by 2020-21) per QALY as benchmarks for cost-effectiveness. Additional sources: https://pmc.ncbi.nlm.nih.gov/articles/PMC10114019/ | https://icer.org/our-approach/methods-process/cost-effectiveness-the-qaly-and-the-evlyg/
We estimate that a nuclear war between the United States and Russia would produce 150 Tg of soot and lead to 5 billion people dying at the end of year 2. Additional sources: https://www.nature.com/articles/s43016-022-00573-0
Recent surveys: 49-51% willingness (2020-2022) - dramatic drop from 85% (2019) during COVID-19 pandemic Cancer patients when approached: 88% consented to trials (Royal Marsden Hospital) Study type variation: 44.8% willing for drug trial, 76.2% for diagnostic study Top motivation: "Learning more about my health/medical condition" (67.4%) Top barrier: "Worry about experiencing side effects" (52.6%) Additional sources: https://trialsjournal.biomedcentral.com/articles/10.1186/s13063-015-1105-3 | https://www.appliedclinicaltrialsonline.com/view/industry-forced-to-rethink-patient-participation-in-trials | https://pmc.ncbi.nlm.nih.gov/articles/PMC7183682/
In the most recent audit, the Department of Defense (DoD) could not account for approximately 60% of its \(4.1 trillion in assets, amounting to\)2.46 trillion unaccounted for. Alternative title: Pentagon unsupported accounting adjustments (\(6.5T, single year, US Army) In 2015, the Department of Defense's Inspector General reported that the Army could not adequately support\)6.5 trillion in year-end adjustments, indicating severe accounting discrepancies. Additional sources: https://thecommunemag.com/the-pentagon-misplaced-2-46-trillion-an-in-depth-look-at-the-financial-audit-failures | https://accmag.com/audit-pentagon-cannot-account-for-6-5-trillion-dollars-is-taxpayer-money/
.
102.
Tufts CSDD. Cost of drug development.
Various estimates suggest $1.0 - $2.5 billion to bring a new drug from discovery through FDA approval, spread across 10 years. Tufts Center for the Study of Drug Development often cited for $1.0 - $2.6 billion/drug. Industry reports (IQVIA, Deloitte) also highlight $2+ billion figures.
Study of 361 FDA-approved drugs from 1995-2014 (median follow-up 13.2 years): Mean lifetime revenue: $15.2 billion per drug Median lifetime revenue: $6.7 billion per drug Revenue after 5 years: $3.2 billion (mean) Revenue after 10 years: $9.5 billion (mean) Revenue after 15 years: $19.2 billion (mean) Distribution highly skewed: top 25 drugs (7%) accounted for 38% of total revenue ($2.1T of $5.5T) Additional sources: https://www.sciencedirect.com/science/article/pii/S1098301524027542
Using 3-way fixed-effects methodology (disease-country-year) across 66 diseases in 22 countries, this study estimates that drugs launched after 1981 saved 148.7 million life-years in 2013 alone. The regression coefficients for drug launches 0-11 years prior (beta=-0.031, SE=0.008) and 12+ years prior (beta=-0.057, SE=0.013) on years of life lost are highly significant (p<0.0001). Confidence interval for life-years saved: 79.4M-239.8M (95 percent CI) based on propagated standard errors from Table 2.
Deloitte’s annual study of top 20 pharma companies by R&D spend (2010-2024): 2024 ROI: 5.9% (second year of growth after decade of decline) 2023 ROI: 4.3% (estimated from trend) 2022 ROI: 1.2% (historic low since study began, 13-year low) 2021 ROI: 6.8% (record high, inflated by COVID-19 vaccines/treatments) Long-term trend: Declining for over a decade before 2023 recovery Average R&D cost per asset: $2.3B (2022), $2.23B (2024) These returns (1.2-5.9% range) fall far below typical corporate ROI targets (15-20%) Additional sources: https://www.deloitte.com/ch/en/Industries/life-sciences-health-care/research/measuring-return-from-pharmaceutical-innovation.html | https://www.prnewswire.com/news-releases/deloittes-13th-annual-pharmaceutical-innovation-report-pharma-rd-return-on-investment-falls-in-post-pandemic-market-301738807.html | https://hitconsultant.net/2023/02/16/pharma-rd-roi-falls-to-lowest-level-in-13-years/
.
106.
Nature Reviews Drug Discovery. Drug trial success rate from phase i to approval. Nature Reviews Drug Discovery: Clinical Success Rateshttps://www.nature.com/articles/nrd.2016.136 (2016)
Overall Phase I to approval: 10-12.8% (conventional wisdom 10%, studies show 12.8%) Recent decline: Average LOA now 6.7% for Phase I (2014-2023 data) Leading pharma companies: 14.3% average LOA (range 8-23%) Varies by therapeutic area: Oncology 3.4%, CNS/cardiovascular lowest at Phase III Phase-specific success: Phase I 47-54%, Phase II 28-34%, Phase III 55-70% Note: 12% figure accurate for historical average. Recent data shows decline to 6.7%, with Phase II as primary attrition point (28% success) Additional sources: https://www.nature.com/articles/nrd.2016.136 | https://pmc.ncbi.nlm.nih.gov/articles/PMC6409418/ | https://academic.oup.com/biostatistics/article/20/2/273/4817524
Phase 3 clinical trials cost between $20 million and $282 million per trial, with significant variation by therapeutic area and trial complexity. Additional sources: https://www.sofpromed.com/how-much-does-a-clinical-trial-cost | https://www.cbo.gov/publication/57126
Meta-analysis of 108 embedded pragmatic clinical trials (2006-2016). The median cost per patient was $97 (IQR $19–$478), based on 2015 dollars. 25% of trials cost <$19/patient; 10 trials exceeded $1,000/patient. U.S. studies median $187 vs non-U.S. median $27. Additional sources: https://pmc.ncbi.nlm.nih.gov/articles/PMC6508852/
For every dollar spent, the return on investment is nearly US$ 39." Total investment cost of US$ 7.5 billion generates projected economic and social benefits of US$ 289.2 billion from sustaining polio assets and integrating them into expanded immunization, surveillance and emergency response programmes across 8 priority countries (Afghanistan, Iraq, Libya, Pakistan, Somalia, Sudan, Syria, Yemen). Additional sources: https://www.who.int/news-room/feature-stories/detail/sustaining-polio-investments-offers-a-high-return
ICBL: Founded 1992 by 6 NGOs (Handicap International, Human Rights Watch, Medico International, Mines Advisory Group, Physicians for Human Rights, Vietnam Veterans of America Foundation) Started with ONE staff member: Jody Williams as founding coordinator Grew to 1,000+ organizations in 60 countries by 1997 Ottawa Process: 14 months (October 1996 - December 1997) Convention signed by 122 states on December 3, 1997; entered into force March 1, 1999 Achievement: Nobel Peace Prize 1997 (shared by ICBL and Jody Williams) Government funding context: Canada established $100M CAD Canadian Landmine Fund over 10 years (1997); International donors provided $169M in 1997 for mine action (up from $100M in 1996) Additional sources: https://www.icrc.org/en/doc/resources/documents/article/other/57jpjn.htm | https://en.wikipedia.org/wiki/International_Campaign_to_Ban_Landmines | https://www.nobelprize.org/prizes/peace/1997/summary/ | https://un.org/press/en/1999/19990520.MINES.BRF.html | https://www.the-monitor.org/en-gb/reports/2003/landmine-monitor-2003/mine-action-funding.aspx
388 former members of Congress are registered as lobbyists. Nearly 5,400 former congressional staffers have left Capitol Hill to become federal lobbyists in the past 10 years. Additional sources: https://www.opensecrets.org/revolving-door
Research identified 1,600+ medicines available in 1962. The 1950s represented industry high-water mark with >30 new products in five of ten years; this rate would not be replicated until late 1990s. More than half (880) of these medicines were lost following implementation of Kefauver-Harris Amendment. The peak of 1962 would not be seen again until early 21st century. By 2016 number of organizations actively involved in R&D at level not seen since 1914.
Pre-1962: Average cost per new chemical entity (NCE) was $6.5 million (1980 dollars) Inflation-adjusted to 2024 dollars: $6.5M (1980) ≈ $22.5M (2024), using CPI multiplier of 3.46× Real cost increase (inflation-adjusted): $22.5M (pre-1962) → $2,600M (2024) = 116× increase Note: This represents the most comprehensive academic estimate of pre-1962 drug development costs based on empirical industry data Additional sources: https://samizdathealth.org/wp-content/uploads/2020/12/hlthaff.1.2.6.pdf
Pre-1962: Physicians could report real-world evidence directly 1962 Drug Amendments replaced "premarket notification" with "premarket approval", requiring extensive efficacy testing Impact: New regulatory clampdown reduced new treatment production by 70%; lifespan growth declined from 4 years/decade to 2 years/decade Drug Efficacy Study Implementation (DESI): NAS/NRC evaluated 3,400+ drugs approved 1938-1962 for safety only; reviewed >3,000 products, >16,000 therapeutic claims FDA has had authority to accept real-world evidence since 1962, clarified by 21st Century Cures Act (2016) Note: Specific "144,000 physicians" figure not verified in sources Additional sources: https://thinkbynumbers.org/health/how-many-net-lives-does-the-fda-save/ | https://www.fda.gov/drugs/enforcement-activities-fda/drug-efficacy-study-implementation-desi | http://www.nasonline.org/about-nas/history/archives/collections/des-1966-1969-1.html
The RECOVERY trial, for example, cost only about $500 per patient... By contrast, the median per-patient cost of a pivotal trial for a new therapeutic is around $41,000. Additional sources: https://manhattan.institute/article/slow-costly-clinical-trials-drag-down-biomedical-breakthroughs
Dexamethasone saved 1 million lives worldwide (NHS England estimate, March 2021, 9 months after discovery). UK alone: 22,000 lives saved. Methodology: Águas et al. Nature Communications 2021 estimated 650,000 lives (range: 240,000-1,400,000) for July-December 2020 alone, based on RECOVERY trial mortality reductions (36% for ventilated, 18% for oxygen-only patients) applied to global COVID hospitalizations. June 2020 announcement: Dexamethasone reduced deaths by up to 1/3 (ventilated patients), 1/5 (oxygen patients). Impact immediate: Adopted into standard care globally within hours of announcement. Additional sources: https://www.england.nhs.uk/2021/03/covid-treatment-developed-in-the-nhs-saves-a-million-lives/ | https://www.nature.com/articles/s41467-021-21134-2 | https://pharmaceutical-journal.com/article/news/steroid-has-saved-the-lives-of-one-million-covid-19-patients-worldwide-figures-show | https://www.recoverytrial.net/news/recovery-trial-celebrates-two-year-anniversary-of-life-saving-dexamethasone-result
2,977 people were killed in the September 11, 2001 attacks: 2,753 at the World Trade Center, 184 at the Pentagon, and 40 passengers and crew on United Flight 93 in Shanksville, Pennsylvania.
Singapore GDP per capita (2023): $82,000 - among highest in the world Government spending: 15% of GDP (vs US 38%) Life expectancy: 84.1 years (vs US 77.5 years) Singapore demonstrates that low government spending can coexist with excellent outcomes Additional sources: https://data.worldbank.org/country/singapore
Singapore government spending is approximately 15% of GDP This is 23 percentage points lower than the United States (38%) Despite lower spending, Singapore achieves excellent outcomes: - Life expectancy: 84.1 years (vs US 77.5) - Low crime, world-class infrastructure, AAA credit rating Additional sources: https://www.imf.org/en/Countries/SGP
Life expectancy at birth varies significantly among developed nations: Switzerland: 84.0 years (2023) Singapore: 84.1 years (2023) Japan: 84.3 years (2023) United States: 77.5 years (2023) - 6.5 years below Switzerland, Singapore Global average: 73 years Note: US spends more per capita on healthcare than any other nation, yet achieves lower life expectancy Additional sources: https://www.who.int/data/gho/data/themes/mortality-and-global-health-estimates/ghe-life-expectancy-and-healthy-life-expectancy
Population-level: Up to 14% (9% men, 14% women) of total life expectancy gain since 1960 due to tobacco control efforts Individual cessation benefits: Quitting at age 35 adds 6.9-8.5 years (men), 6.1-7.7 years (women) vs continuing smokers By cessation age: Age 25-34 = 10 years gained; age 35-44 = 9 years; age 45-54 = 6 years; age 65 = 2.0 years (men), 3.7 years (women) Cessation before age 40: Reduces death risk by 90% Long-term cessation: 10+ years yields survival comparable to never smokers, averts 10 years of life lost Recent cessation: <3 years averts 5 years of life lost Additional sources: https://www.ncbi.nlm.nih.gov/pmc/articles/PMC1447499/ | https://www.cdc.gov/pcd/issues/2012/11_0295.htm | https://www.ajpmonline.org/article/S0749-3797(24)00217-4/fulltext | https://www.nejm.org/doi/full/10.1056/NEJMsa1211128
Standard economic value per QALY: $100,000–$150,000. This is the US and global standard willingness-to-pay threshold for interventions that add costs. Dominant interventions (those that save money while improving health) are favorable regardless of this threshold. Additional sources: https://icer.org/wp-content/uploads/2024/02/Reference-Case-4.3.25.pdf
Consumer costs: $2.5-3.5 billion per year (GAO estimate) Net economic cost: $1 billion per year 2022: US consumers paid 2X world price for sugar Program costs $3-4 billion/year but no federal budget impact (costs passed directly to consumers via higher prices) Employment impact: 10,000-20,000 manufacturing jobs lost annually in sugar-reliant industries (confectionery, etc.) Multiple studies confirm: Sweetener Users Association ($2.9-3.5B), AEI ($2.4B consumer cost), Beghin & Elobeid ($2.9-3.5B consumer surplus) Additional sources: https://www.gao.gov/products/gao-24-106144 | https://www.heritage.org/agriculture/report/the-us-sugar-program-bad-consumers-bad-agriculture-and-bad-america | https://www.aei.org/articles/the-u-s-spends-4-billion-a-year-subsidizing-stalinist-style-domestic-sugar-production/
2023: 0.70272% of GDP (World Bank) 2024: CHF 5.95 billion official military spending When including militia system costs: 1% GDP (CHF 8.75B) Comparison: Near bottom in Europe; only Ireland, Malta, Moldova spend less (excluding microstates with no armies) Additional sources: https://data.worldbank.org/indicator/MS.MIL.XPND.GD.ZS?locations=CH | https://www.avenir-suisse.ch/en/blog-defence-spending-switzerland-is-in-better-shape-than-it-seems/ | https://tradingeconomics.com/switzerland/military-expenditure-percent-of-gdp-wb-data.html
2024 GDP per capita (PPP-adjusted): Switzerland $93,819 vs United States $75,492 Switzerland’s GDP per capita 24% higher than US when adjusted for purchasing power parity Nominal 2024: Switzerland $103,670 vs US $85,810 Additional sources: https://data.worldbank.org/indicator/NY.GDP.PCAP.CD?locations=CH | https://tradingeconomics.com/switzerland/gdp-per-capita-ppp | https://www.theglobaleconomy.com/USA/gdp_per_capita_ppp/
OECD government spending data shows significant variation among developed nations: United States: 38.0% of GDP (2023) Switzerland: 35.0% of GDP - 3 percentage points lower than US Singapore: 15.0% of GDP - 23 percentage points lower than US (per IMF data) OECD average: approximately 40% of GDP Additional sources: https://data.oecd.org/gga/general-government-spending.htm
The total number of embryos affected by the use of thalidomide during pregnancy is estimated at 10,000, of whom about 40% died around the time of birth. More than 10,000 children in 46 countries were born with deformities such as phocomelia. Additional sources: https://en.wikipedia.org/wiki/Thalidomide_scandal
Study of thalidomide survivors documenting ongoing disability impacts, quality of life, and long-term health outcomes. Survivors (now in their 60s) continue to experience significant disability from limb deformities, organ damage, and other effects. Additional sources: https://journals.plos.org/plosone/article?id=10.1371/journal.pone.0210222
US Census Bureau historical estimates of world population by country and region (1950-2050). US population in 1960: 180 million of 3 billion worldwide (6%). Additional sources: https://www.census.gov/data/tables/time-series/demo/international-programs/historical-est-worldpop.html
Overall, the 138 clinical trials had an estimated median (IQR) cost of $19.0 million ($12.2 million-$33.1 million)... The clinical trials cost a median (IQR) of $41,117 ($31,802-$82,362) per patient. Additional sources: https://www.ncbi.nlm.nih.gov/pmc/articles/PMC6248200/
Disability weights for 235 health states used in Global Burden of Disease calculations. Weights range from 0 (perfect health) to 1 (death equivalent). Chronic conditions like diabetes (0.05-0.35), COPD (0.04-0.41), depression (0.15-0.66), and cardiovascular disease (0.04-0.57) show substantial variation by severity. Treatment typically reduces disability weights by 50-80 percent for manageable chronic conditions.
Chronic diseases account for 90% of U.S. healthcare spending ( $3.7T/year). Additional sources: https://www.cdc.gov/chronic-disease/data-research/facts-stats/index.html
US GDP reached $28.78 trillion in 2024, representing approximately 26% of global GDP. Additional sources: https://data.worldbank.org/indicator/NY.GDP.MKTP.CD?locations=US | https://www.bea.gov/news/2024/gross-domestic-product-fourth-quarter-and-year-2024-advance-estimate
.
143.
Environmental Working Group. US farm subsidy database and analysis. Environmental Working Grouphttps://farm.ewg.org/ (2024)
US agricultural subsidies total approximately $30 billion annually, but create much larger economic distortions. Top 10% of farms receive 78% of subsidies, benefits concentrated in commodity crops (corn, soy, wheat, cotton), environmental damage from monoculture incentivized, and overall deadweight loss estimated at $50-120 billion annually. Additional sources: https://farm.ewg.org/ | https://www.ers.usda.gov/topics/farm-economy/farm-sector-income-finances/government-payments-the-safety-net/
Since 1971, the war on drugs has cost the United States an estimated $1 trillion in enforcement. The federal drug control budget was $41 billion in 2022. Mass incarceration costs the U.S. at least $182 billion every year, with over $450 billion spent to incarcerate individuals on drug charges in federal prisons.
Globally, fossil fuel subsidies were $7 trillion in 2022 or 7.1 percent of GDP. The United States subsidies totaled $649 billion. Underpricing for local air pollution costs and climate damages are the largest contributor, accounting for about 30 percent each.
The US spent approximately twice as much as other high-income countries on medical care (mean per capita: $9,892 vs $5,289), with similar utilization but much higher prices. Administrative costs accounted for 8% of US spending vs 1-3% in other countries. US spending on pharmaceuticals was $1,443 per capita vs $749 elsewhere. Despite spending more, US health outcomes are not better. Additional sources: https://jamanetwork.com/journals/jama/article-abstract/2674671
We quantify the amount of spatial misallocation of labor across US cities and its aggregate costs. Tight land-use restrictions in high-productivity cities like New York, San Francisco, and Boston lowered aggregate US growth by 36% from 1964 to 2009. Local constraints on housing supply have had enormous effects on the national economy. Additional sources: https://www.aeaweb.org/articles?id=10.1257/mac.20170388
Accounting for all the 2025 US tariffs and retaliation implemented to date, the level of real GDP is persistently -0.6% smaller in the long run, the equivalent of $160 billion 2024$ annually.
Americans will spend over 7.9 billion hours complying with IRS tax filing and reporting requirements in 2024. This costs the economy roughly $413 billion in lost productivity. In addition, the IRS estimates that Americans spend roughly $133 billion annually in out-of-pocket costs, bringing the total compliance costs to $546 billion, or nearly 2 percent of GDP.
Heart failure alone: $108 billion/year (2012 global analysis, 197 countries) US CVD: $555B (2016) → projected $1.8T by 2050 LMICs total CVD loss: $3.7T cumulative (2011-2015, 5-year period) CVD is costliest disease category in most developed nations Note: No single $2.1T global figure found; estimates vary widely by scope and year Additional sources: https://www.ahajournals.org/doi/10.1161/CIR.0000000000001258
US life expectancy at birth was 77.5 years in 2023 Male life expectancy: 74.8 years Female life expectancy: 80.2 years This is 6-7 years lower than peer developed nations despite higher healthcare spending Additional sources: https://www.cdc.gov/nchs/fastats/life-expectancy.htm
US median household income was $77,500 in 2023 Real median household income declined 0.8% from 2022 Gini index: 0.467 (income inequality measure) Additional sources: https://www.census.gov/library/publications/2024/demo/p60-282.html
US military spending in constant 2024 dollars: 1939 $29B (pre-WW2 baseline), 1940 $37B, 1944 $1,383B, 1945 $1,420B (peak), 1946 $674B, 1947 $176B, 1948 $117B, 2024 $886B. The post-WW2 demobilization cut spending 88% in two years (1945-1947). Current peacetime spending ($886B) is 30x the pre-WW2 baseline and 62% of peak WW2 spending, in inflation-adjusted dollars.
U.S. military spending amounted to 3.5% of GDP in 2024. In 2024, the U.S. spent nearly $1 trillion on its military budget, equal to 3.4% of GDP. Additional sources: https://www.statista.com/statistics/262742/countries-with-the-highest-military-spending/ | https://www.sipri.org/sites/default/files/2025-04/2504_fs_milex_2024.pdf
73.6% (or 174 million people) of the citizen voting-age population was registered to vote in 2024 (Census Bureau). More than 211 million citizens were active registered voters (86.6% of citizen voting age population) according to the Election Assistance Commission. Additional sources: https://www.census.gov/newsroom/press-releases/2025/2024-presidential-election-voting-registration-tables.html | https://www.eac.gov/news/2025/06/30/us-election-assistance-commission-releases-2024-election-administration-and-voting
The Constitution provides that the president ’shall have Power, by and with the Advice and Consent of the Senate, to make Treaties, provided two-thirds of the Senators present concur’ (Article II, section 2). Treaties are formal agreements with foreign nations that require two-thirds Senate approval. 67 senators (two-thirds of 100) must vote to ratify a treaty for it to take effect. Additional sources: https://www.senate.gov/about/powers-procedures/treaties.htm
Presidential candidates raised $2 billion; House and Senate candidates raised $3.8 billion and spent $3.7 billion; PACs raised $15.7 billion and spent $15.5 billion. Total federal campaign spending approximately $20 billion. Additional sources: https://www.fec.gov/updates/statistical-summary-of-24-month-campaign-activity-of-the-2023-2024-election-cycle/
Total federal lobbying reached record $4.4 billion in 2024. The $150 million increase in lobbying continues an upward trend that began in 2016. Additional sources: https://www.opensecrets.org/news/2025/02/federal-lobbying-set-new-record-in-2024/
National average: 1 in 60 million chance (2008 election analysis by Gelman, Silver, Edlin) Swing states (NM, VA, NH, CO): 1 in 10 million chance Non-competitive states: 34 states >1 in 100 million odds; 20 states >1 in 1 billion Washington DC: 1 in 490 billion odds Methodology: Probability state is necessary for electoral college win × probability state vote is tied Additional sources: https://sites.stat.columbia.edu/gelman/research/published/probdecisive2.pdf | https://onlinelibrary.wiley.com/doi/abs/10.1111/j.1465-7295.2010.00272.x
The overall failure rate of drugs that passed into Phase 1 trials to final approval is 90%. This lack of translation from promising preclinical findings to success in human trials is known as the "valley of death." Estimated 30-50% of promising compounds never proceed to Phase 2/3 trials primarily due to funding barriers rather than scientific failure. The late-stage attrition rate for oncology drugs is as high as 70% in Phase II and 59% in Phase III trials.
Current VSL (2024): $13.7 million (updated from $13.6M) Used in cost-benefit analyses for transportation regulations and infrastructure Methodology updated in 2013 guidance, adjusted annually for inflation and real income VSL represents aggregate willingness to pay for safety improvements that reduce fatalities by one Note: DOT has published VSL guidance periodically since 1993. Current $13.7M reflects 2024 inflation/income adjustments Additional sources: https://www.transportation.gov/office-policy/transportation-policy/revised-departmental-guidance-on-valuation-of-a-statistical-life-in-economic-analysis | https://www.transportation.gov/regulations/economic-values-used-in-analysis
India: $23-$50 per DALY averted (least costly intervention, $1,000-$6,100 per death averted) Sub-Saharan Africa (2022): $220-$860 per DALY (Burkina Faso: $220, Kenya: $550, Nigeria: $860) WHO estimates for Africa: $40 per DALY for fortification, $255 for supplementation Uganda fortification: $18-$82 per DALY (oil: $18, sugar: $82) Note: Wide variation reflects differences in baseline VAD prevalence, coverage levels, and whether intervention is supplementation or fortification Additional sources: https://journals.plos.org/plosone/article?id=10.1371/journal.pone.0012046 | https://journals.plos.org/plosone/article?id=10.1371/journal.pone.0266495
The $50,000/QALY threshold is widely used in US health economics literature, originating from dialysis cost benchmarks in the 1980s. In US cost-utility analyses, 77.5% of authors use either $50,000 or $100,000 per QALY as reference points. Most successful health programs cost $3,000-10,000 per QALY. WHO-CHOICE uses GDP per capita multiples (1× GDP/capita = "very cost-effective", 3× GDP/capita = "cost-effective"), which for the US ( $70,000 GDP/capita) translates to $70,000-$210,000/QALY thresholds. Additional sources: https://pmc.ncbi.nlm.nih.gov/articles/PMC5193154/ | https://pmc.ncbi.nlm.nih.gov/articles/PMC9278384/
78.4% of U.S. employees have at least one chronic condition (7% increase since 2021) 58% of employees report physical chronic health conditions 28% of all employees experience productivity loss due to chronic conditions Average productivity loss: $4,798 per employee per year Employees with 3+ chronic conditions miss 7.8 days annually vs 2.2 days for those without Note: 28% productivity loss translates to roughly 11 hours per week (28% of 40-hour workweek) Additional sources: https://www.ibiweb.org/resources/chronic-conditions-in-the-us-workforce-prevalence-trends-and-productivity-impacts | https://www.onemedical.com/mediacenter/study-finds-more-than-half-of-employees-are-living-with-chronic-conditions-including-1-in-3-gen-z-and-millennial-employees/ | https://debeaumont.org/news/2025/poll-the-toll-of-chronic-health-conditions-on-employees-and-workplaces/
Study by Martin Gilens (Princeton) and Benjamin I. Page (Northwestern): Analyzed 1,779 policy outcomes (1981-2002) Finding: "Economic elites and organized groups representing business interests have substantial independent impacts on U.S. government policy, while average citizens have little or no independent influence Rich, well-connected individuals steer the country’s direction, regardless of or even against the will of the majority of voters Note: Specific "78 percent" and "zero percent correlation" statistics not found in sources Additional sources: https://scholar.princeton.edu/sites/default/files/mgilens/files/gilens_and_page_2014_-testing_theories_of_american_politics.doc.pdf | https://act.represent.us/sign/usa-oligarchy-research-explained | https://archive.org/details/gilens_and_page_2014_-testing_theories_of_american_politics.doc
Net income (2000-2018): 35 large pharma companies earned $1.9T cumulative net income on $11.5T revenue 2022 profits: Major pharma companies made >$112B in profits Profit margins: Pharma companies 13.8% median vs 7.7% for other S&P 500 companies Largest 25 companies: 15-20% annual average profit margin vs 4-9% for non-drug companies globally Profitability: Pharma significantly more profitable than most S&P 500 companies Additional sources: https://pmc.ncbi.nlm.nih.gov/articles/PMC7054843/ | https://www.bentley.edu/news/new-research-shows-pharma-companies-are-more-profitable-most-sp-500-companies | https://www.gao.gov/products/gao-18-40
Authorized: $700 billion (later reduced to $475 billion by Dodd-Frank) Actual disbursed: $443.5 billion to stabilize financial institutions Bank rescue: $236 billion to 707 financial institutions in 48 states Breakdown: $250B banking, $82B auto industry, $70B AIG, $46B foreclosure programs Net lifetime cost: $31.1 billion (after repayments, sales, dividends, interest); most attributable to foreclosure programs Passed October 3, 2008 (signed by President Bush); Emergency Economic Stabilization Act Additional sources: https://home.treasury.gov/data/troubled-assets-relief-program/about-tarp | https://en.wikipedia.org/wiki/Troubled_Asset_Relief_Program | https://www.propublica.org/article/the-bailout-was-11-years-ago-were-still-tracking-every-penny
Classic study of crowd psychology, financial bubbles, and mass delusions. Documents how groups of individually rational people can collectively produce irrational outcomes when independence of judgment breaks down. Covers the South Sea Bubble, Tulip Mania, and other episodes where the wisdom of crowds became the madness of crowds.
First rigorous scientific analysis of circular milling (death spiral) behavior in army ants (Labidus praedator) observed on Barro Colorado Island, Panama. Describes how ants separated from the main column lose pheromone trails and form circular mills, each ant following the one ahead until exhaustion and death.
Research: Only 1 in 4 studies support notion that contributions directly "buy votes Influence mechanism: Access, agenda-setting, keeping bills off floor, earmarks, key language in legislation (not direct votes) Average winner costs (2022): House $2.79M, Senate $26.53M; Competitive races much higher Internal party fundraising requirements: $100K-$30M annually; Committee positions cost $450K 95% of House races since 2004 won by highest spender Contribution limits: $3,300 per candidate per election (individuals); PACs gave $289.3M total (2021-2022) Additional sources: https://www.sciencedirect.com/science/article/pii/S0047272725000179 | https://slate.com/news-and-politics/2010/10/how-much-does-it-cost-to-buy-a-vote.html | https://www.opensecrets.org/elections-overview/cost-of-election | https://issueone.org/articles/the-118th-congress-fundraising-treadmill/
Each $1,000 spent on lobbying correlated with $25,000 funding increase following year (53 diseases, 19 years) Rare disease advocates increased NIH rare-disease funding 3-15%/year (1998-2008) via millions in lobbying Specific examples: Alzheimer’s Association secured $100M NIH increase (FY2024); ME/CFS Initiative helped secure >$1B for long-COVID General ratio: Disease advocacy lobbying yields significant ROI, though specific "$100M → $1.8B" not verified Additional sources: https://www.stern.nyu.edu/experience-stern/news-events/new-research-finds-special-interest-lobbying-does-influence-nih-research-funding | https://www.nature.com/articles/515019a | https://www.alz.org/news/2024/congress-bipartisan-funding-alzheimers-research
Recommended: 4 hours "call time" + 1 hour "strategic outreach" = 5 hours/day out of 9-10 hour workday New members told to spend 30 hours/week on fundraising calls since Citizens United Tom Daschle: 67% of schedule is money-gathering in 2 years before election Only 3-4 hours/day for actual Congressional work (hearings, votes, constituents) Note: By law, members cannot fundraise from offices; parties set up call centers near Capitol Additional sources: https://www.cbsnews.com/news/60-minutes-are-members-of-congress-becoming-telemarketers/ | https://www.huffpost.com/entry/call-time-congressional-fundraising_n_2427291
In the 110th Congress, the House dealt with 7,441 bills and joint resolutions averaging 16.7 pages per law, totaling approximately 125,000 pages. At 300 words per minute (average college graduate reading speed), reading just the 1,427-page Waxman-Markey bill would take 12 hours. Cites Washington Post editorial on impossibility of legislators reading all proposed legislation.
House bill to weaken Dodd-Frank financial regulations: 70 of 85 lines reflected Citigroup lobbyist recommendations. Two paragraphs copied almost word for word, with only two words changed to make them plural. Bill sought to eliminate push-out rule preventing banks from using customer deposits for derivative trading.
Investigation of nearly 1 million bills across all 50 states found at least 10,000 bills almost entirely copied from model legislation introduced over eight years, with more than 2,100 signed into law. Sources: 4,301 from industry (42%), 4,012 from conservative groups (40%), 1,602 from liberal groups (16%), 248 other (2%).
Introduced: October 23, 2001 by Rep. Jim Sensenbrenner (R-WI) as H.R. 3162 Passed House: October 24, 2001 (357-66 vote, Democrats majority of "no" votes) Passed Senate: October 25, 2001 (98-1 vote, only Russ Feingold D-WI voted "no") Signed into law: October 26, 2001 by President George W. Bush Length: 342 pages, passed hastily without public opportunity for review ACLU concern: Senate forced to vote on legislation it hadn’t had opportunity to read (offices closed, staff couldn’t access papers) Additional sources: https://en.wikipedia.org/wiki/Patriot_Act | https://www.britannica.com/topic/USA-PATRIOT-Act | https://www.ala.org/advocacy/chronology-usa-patriot-act-2001
The Affordable Care Act: 2,700 pages, "we have to pass it to see what’s in it. Additional sources: https://www.congress.gov/bill/111th-congress/house-bill/3590/text | https://www.snopes.com/fact-check/pelosi-healthcare-pass-the-bill-to-see-what-is-in-it/
DCCC (Democratic): Speaker $31 million, "A" Committee Chairs $1.8 million, Regular members $150,000 minimum NRCC (Republican): Speaker $20 million, Power Committee Chairs $1.2 million, Transportation Chair $875,000 Members display "giant tally sheet" showing who has/hasn’t paid their party dues Members who don’t pay dues get bills killed, amendments ignored, worse offices Rep. Brett Guthrie: Paid $2.5 million (53% of campaign funds) for Energy & Commerce Chair Rep. Rosa DeLauro: Paid $690,000 (39% of campaign funds) for Appropriations Note: System criticized as "recipe for corruption" disconnecting members from constituents Additional sources: https://www.issueone.org/wp-content/uploads/2017/05/price-of-power-final.pdf | https://theintercept.com/2019/09/03/dccc-house-committees-dues/ | https://www.brookings.edu/articles/problems-with-the-committee-tax-in-congress/ | https://rollcall.com/2023/02/09/gavels-for-top-house-committees-dont-always-come-cheap/
James McGill Buchanan: 1986 Nobel Memorial Prize in Economic Sciences Citation: "for his development of the contractual and constitutional bases for the theory of economic and political decision-making Field: Public choice theory (leading researcher & cofounder with Gordon Tullock) Key work: "The Calculus of Consent" (with Tullock) - now considered a classic, started the field Contribution: Transferred concept of gain from mutual exchange between individuals to political decision-making; applied economic analysis to public sector Inspiration: Swedish economist Knut Wicksell (described as "most exciting intellectual moment" of career) Additional sources: https://www.nobelprize.org/prizes/economic-sciences/1986/press-release/ | https://en.wikipedia.org/wiki/James_M._Buchanan | https://www.britannica.com/money/James-M-Buchanan | https://www.econlib.org/library/Enc/bios/Buchanan.html
Members of Congress: $174,000/year (2009-present) Speaker of the House: $223,500/year Majority/Minority Leaders: $193,400/year Note: Congressional salary has been frozen at $174,000 since 2009, unchanged for over 15 years Additional sources: https://www.senate.gov/senators/SenateSalariesSince1789.htm | https://crsreports.congress.gov
Citizens United v. FEC (2010): 5-4 Supreme Court decision allowing unlimited corporate/union political spending Overruled restrictions on independent expenditures, citing First Amendment Led to creation of super PACs and massive increases in dark money Dramatically expanded influence of wealthy donors, corporations, special interest groups Note: Overwhelming majorities of Americans disapprove; 22+ states voted to support constitutional amendment to overturn Additional sources: https://supreme.justia.com/cases/federal/us/558/310/ | https://www.brennancenter.org/our-work/research-reports/citizens-united-explained
Medicare Prescription Drug, Improvement, and Modernization Act (P.L. 108-173): Signed Dec 8, 2003 by President Bush; created voluntary Part D prescription drug benefit Noninterference provision": Prohibits HHS Secretary from negotiating drug prices or establishing preferred drug list Instead: Drug prices negotiated between manufacturers & insurance companies administering Part D plans Pharma industry role in writing: "Noninterference clause" written with major industry involvement; drug manufacturers had major role writing & getting it through Congress Industry lobbying: $231M spent on lobbying in 2003 (more than any other industry since 1998) Rep. Billy Tauzin example: 2004 appointed PhRMA chief lobbyist ($2M/year rumored); responsible for including price negotiation prohibition 2022 change: Inflation Reduction Act removed ban; Medicare can negotiate starting 2026 Additional sources: https://en.wikipedia.org/wiki/Medicare_Prescription_Drug,_Improvement,_and_Modernization_Act | https://www.healthaffairs.org/content/forefront/politics-medicare-and-drug-price-negotiation-updated | https://www.congress.gov/crs-products/product/pdf/R/R47872
1923: Frederick Banting, Charles Best, James Collip sold insulin patent to U. of Toronto for $1 each (total $3) Banting: Unethical for doctor to profit from life-saving discovery; wanted everyone to afford it Manufacturing cost: $6 per vial US retail price: $300-332 per vial (Humalog: $21 in 1999 → $332 in 2019 = 1,000%+ increase) Price increases: 600% over 20 years; 200% between 2007-2018 Patients without insurance: Up to $1,000/month Contributing factors: Patent evergreening, barriers to biosimilar entry, market concentration (Eli Lilly, Novo Nordisk, Sanofi) Additional sources: https://www.snopes.com/fact-check/insulin-patent-dollar/ | https://www.t1international.com/100years/ | https://pnhp.org/news/why-insulin-is-overpriced/ | https://www.npr.org/2019/06/18/733742630/desperate-measures-the-skyrocketing-price-of-insulin-in-america
Political contributions 2022: $3,946,639 (PAC + individuals); PAC alone: $1,542,500 to federal candidates (2021-2022 cycle) Lobbying 2022: $13.6M expenditure (focused on military appropriations, foreign military sales) Geographic footprint: Operations in over half of states; employs 1,000-20,000+ per state Additional sources: https://www.opensecrets.org/orgs/lockheed-martin/summary?id=d000000104 | https://www.opensecrets.org/political-action-committees-pacs/lockheed-martin/C00303024/candidate-recipients/2022 | https://www.taxpayer.net/wp-content/uploads/2024/10/Oct-2024-Political-Footprint-of-the-Military-Industry.pdf
Pape analyzed every suicide terrorist attack worldwide from 1980 to 2003, finding that 95 percent were in response to foreign military occupation. The data contradicts narratives attributing suicide terrorism primarily to religious fundamentalism.
20 years of post-9/11 wars cost the U.S. an estimated $8 trillion and killed more than 900,000 people. Breakdown: $2.1T DOD operations, $1.1T homeland security, $1.1T interest on borrowing, $884B DOD base budget increases, $465B veterans’ care, $2.3T Afghanistan/Pakistan, $2.1T Iraq/Syria. Future: $2.2T for veteran care already set aside. Additional sources: https://www.brown.edu/news/2021-09-01/costsofwar | https://watson.brown.edu/costsofwar/costs/economic
Analysis of terrorism trends showing dramatic increase in global terrorist attacks after 2001, with attacks rising from roughly 1,000 per year in 2004 to nearly 17,000 by 2014, driven primarily by proliferation of jihadist organizations in Iraq, Afghanistan, Pakistan, Nigeria, and Syria.
Pharmaceutical and health products industry spent $388 million on federal lobbying in 2024 ($6.1 billion since 1999) Employs roughly 3 lobbyists for every member of Congress Note: The industry has consistently been among the top spenders on lobbying in Washington D.C., with major pharmaceutical companies like Pfizer, AbbVie, and PhRMA leading expenditures Additional sources: https://www.opensecrets.org/industries/indus?ind=H04
FY2023: User fees = 75% of PDUFA program costs (vs 7% in FY1993) FY2022: User fees = 66% ($1.4B) of human drugs program budget FY2022: User fees = 46% ($2.9B) of FDA’s total $6.2B budget Pharma finances 75% of FDA’s drug division (New York Times) Concerns: Budgetary dependence, urgency of PDUFA reauthorizations, required industry participation in negotiations Most PDUFA policy changes favor industry: decreased regulatory standards, shorter approval times, increased industry involvement FDA maintains decisions based on science, not fee collection ability Note: Regulatory capture concerns well-documented. Industry funding grew from 7% (1993) to 75% (2023) of drug review program. No evidence found for "10x government salary" claim for FDA reviewers Additional sources: https://www.congress.gov/crs-product/R44750 | https://aspe.hhs.gov/sites/default/files/documents/e4a7910607c0dd76c40aa61151d154f9/FDA-User-Fee-Issue-Brief.pdf | https://pmc.ncbi.nlm.nih.gov/articles/PMC8917050/
US GDP increased from $228 billion in 1945 to just under $1.7 trillion in 1975. Average real GDP growth from 1950 to 1980 was around 4.1% annually, compared to 3.1% from 1981 to 2008. Additional sources: https://en.wikipedia.org/wiki/Post–World_War_II_economic_expansion | https://www.stlouisfed.org/timely-topics/house-prices-homeownership-rise
Your governments possess nuclear weapons sufficient to end civilization 122 times but have not cured Alzheimer’s once. This treaty asks them to be 1% more rational.
6.65 thousand diseases have zero FDA-approved treatments; at current trial capacity, exploring them takes 443 years. Redirecting 1% of military spending scales capacity 12.3x, cutting the timeline to 36 years and preventing 10.7 billion deaths. At $0.00177/DALY, 50.3kx more cost-effective than the best existing interventions. Incentive Alignment Bonds make adoption politically viable.
Government spending is optimized for lobbying intensity, not net societal value. Programs with 100:1 benefit-cost ratios get billions while programs with negative returns get hundreds of billions. Incentive Alignment Bonds flip this by creating a capital pool that rewards politicians (via campaign support and post-office opportunities) for funding high-NSV programs over low-NSV alternatives. The result: public good becomes private profit for both investors and elected officials.
Representative democracy suffers from an inescapable principal-agent problem where elected officials’ incentives diverge from citizen welfare. Wishocracy introduces RAPPA (Randomized Aggregated Pairwise Preference Allocation), which aggregates citizen preferences through cognitively tractable pairwise comparisons and creates accountability via Citizen Alignment Scores that channel electoral resources toward politicians who actually represent what citizens want.
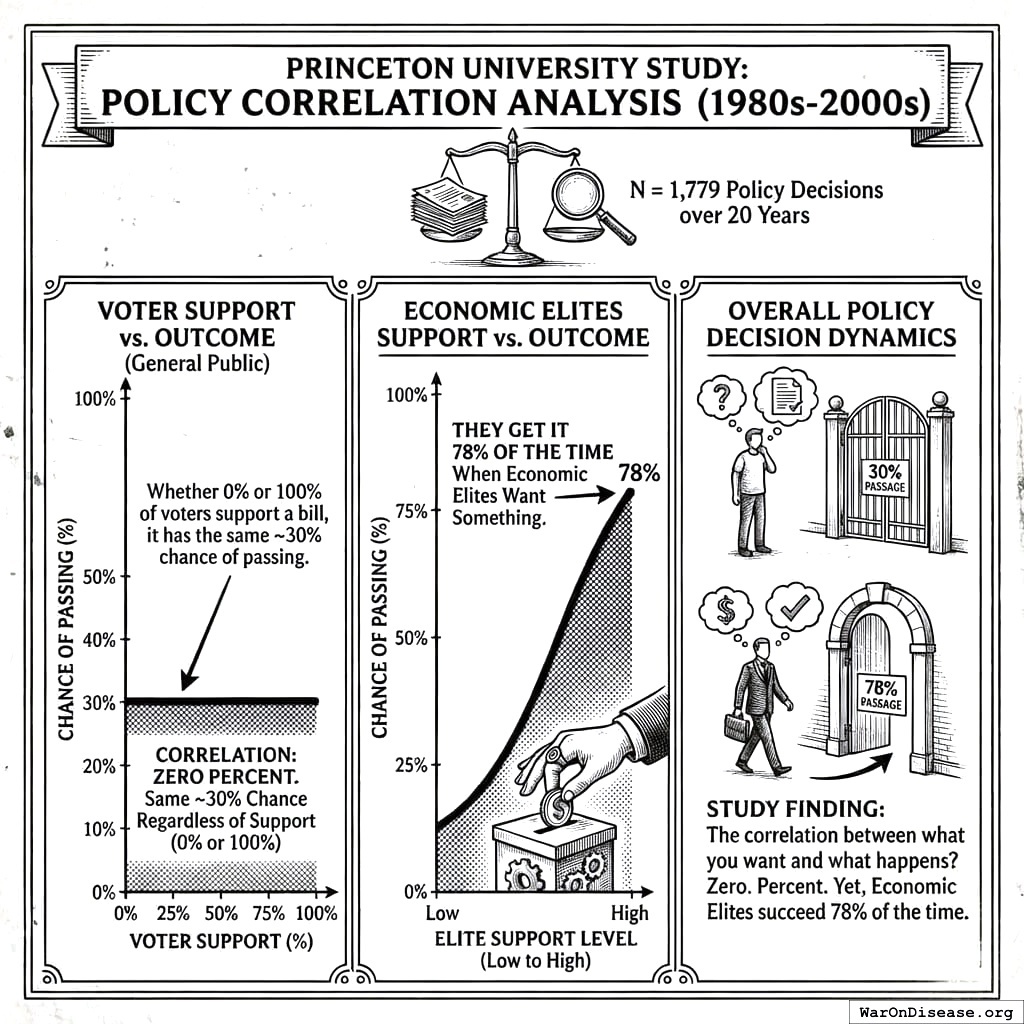
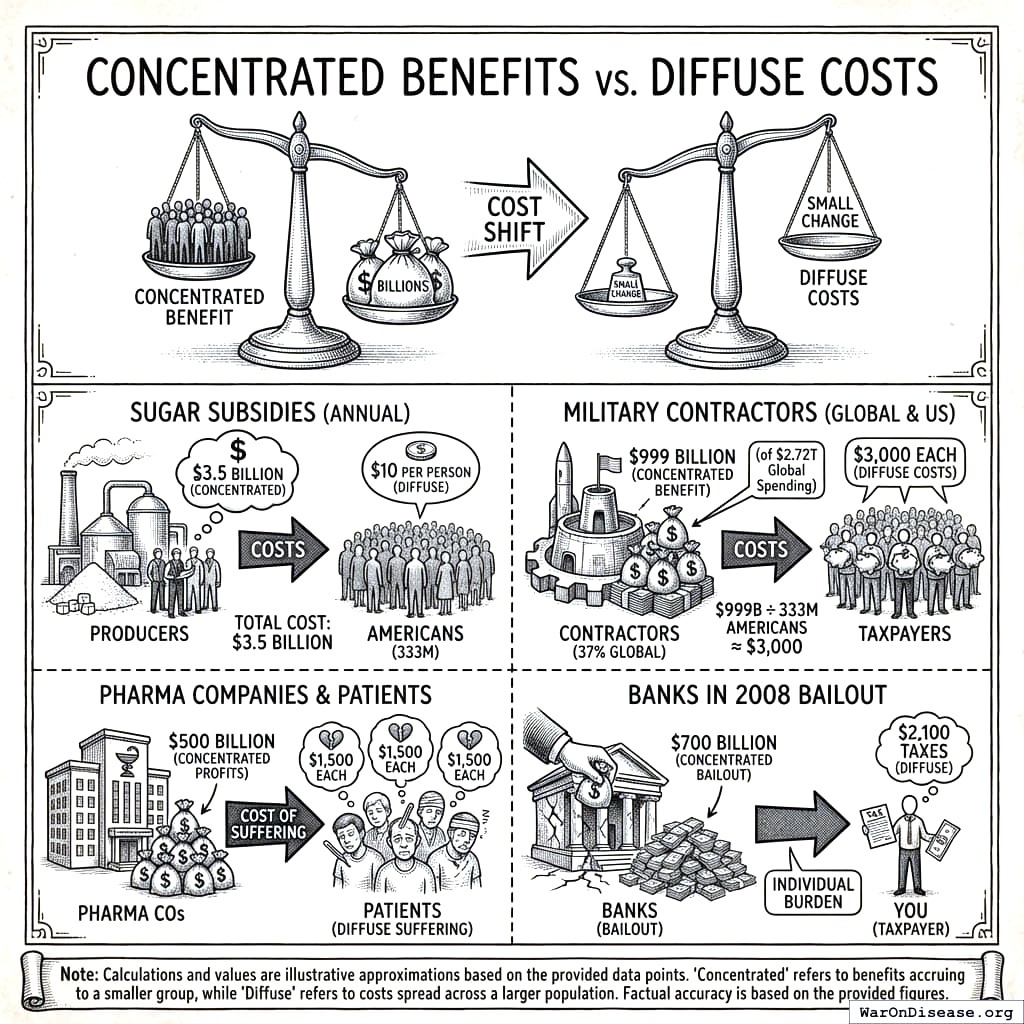
