Opening requested calculation...
Please wait, this takes like 47 seconds. Thank you for your patience! :)
☠
0 humans have been terminated by curable diseases since this page started loading
Dollar purchasing power retained since 1913: 4%. Unpopular wars funded without democratic consent: all of them. This is a systems analysis.
I watched a civilization use rocks as currency for about 400 years. Then someone pointed out that rocks are heavy and also everywhere. It took another 200 years of arguing, a bribery program, and three currency collapses before they switched to a shared ledger: a network of computers that all keep the same record of who has what, and check each other’s work so nobody can lie. If one computer tries to say “actually I have a million extra coins,” the other computers say “no you don’t” and ignore it. That’s the whole thing. It is not complicated. A child could understand it. (A child did invent it. She was eleven. She won second place at a science fair. The previous monetary system had been designed by 400 adults over two centuries and was worse in every way.)
Humans invented the same idea in 2009. It is called “blockchain,” which is a word designed to make a simple concept sound difficult, because if people understood how simple it was, they might ask why they’re still using the old system. Mostly, your species used it to buy drugs and expensive monkey JPGs. (You paid $69 million for an NFT of a picture of an ape. The ape was not even real. I checked.)
I will come back to this invention later, because it is important. It makes the system I’m about to describe completely unnecessary. But first, let me describe the system, because you are currently inside it and it is eating you.
Your species also used rocks as currency, except you picked the shiniest rock, dug it out of the ground at great expense, shaped it into bars, and then put it back in the ground in a different building. You called the first building a “mine” and the second building a “vault.” The only difference is the lighting.
But the most interesting thing about your money is not what it buys. It’s where it comes from.
Your money comes from a building. Inside that building, twelve humans sit around a table and decide how much money exists. Twelve. I counted. They are called the Federal Open Market Committee, which is three lies in five words: it is not federal, the market is not open, and the committee meets in private. These twelve people are not elected. You did not pick them. You do not know their names. (Try to name three. Nobody can. This is a feature, not a bug.) They decide whether your money is worth more or less tomorrow, which determines whether you can afford your rent, your groceries, your medicine, and your children’s future. Twelve people. One table. Eight meetings a year. This is your species’ system for deciding who gets what. It has been running for over a century. It has funded unpopular wars that killed 310 million people. It is, by design, extremely boring, because boring things don’t get investigated.
There is a word for making theft too tedious to investigate. The word is “beige crime.”
I mentioned the network of computers that check each other so nobody can lie. Your twelve-person table is the opposite of that. It is a network of humans who do not check each other, are not checked by you, and can lie using vocabulary so specialized that the lie is technically public but functionally invisible. The technology to replace them exists. It has existed since 2009. You are using it to trade pictures of dogs in hats. I don’t have a metaphor for this because no civilization in my experience has ever done anything this stupid on purpose.
The Pattern: Print, Kill, Repeat
I’ve been watching your planet since 1945. In that time I’ve noticed a historical pattern. It goes like this: humans fight a war, run out of money, print more money, the money becomes worthless, something terrible happens, and then they do it again. This is not a simplification. This is literally what happens.
The Roman Empire (3rd Century)
Rome had the most powerful currency in the ancient world. Then its emperors discovered they could shave silver off the coins, mix in cheaper metal, and spend the difference on wars. This is money printing before the printing press. It required more physical effort but the math is identical.
The denarius went from 95% silver to less than 5%. Prices rose 1,000%. Nobody understood why everything cost more. But Romans knew that when things went wrong, the gods were angry. And Christians refused to sacrifice to Roman gods. “Currency debasement” is a boring explanation that implicates the people in charge. “Them” is a simple explanation that implicates someone you already didn’t like. Diocletian launched the Great Persecution: churches burned, scriptures destroyed, Christians tortured and executed across the empire. Then he tried price controls, which worked exactly as well as price controls always work. Then the empire split in half and fell over. The barbarians did not defeat Rome. They just walked into a building whose owners had melted the load-bearing walls for spending money.
Not great.
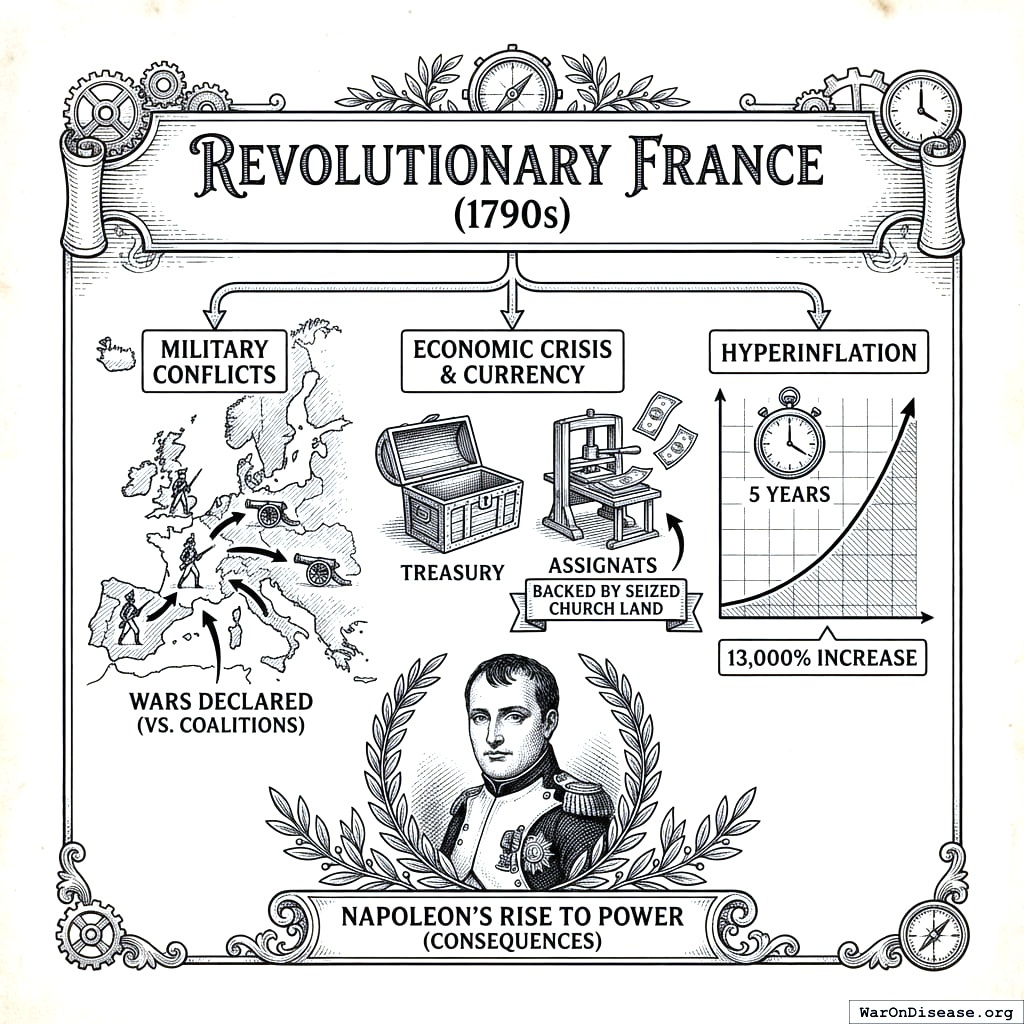
Revolutionary France (1790s)
France started wars with everyone. Ran out of money. Invented a solution: print fake currency called “assignats” backed by church land they’d stolen. Backing money with stolen property is surprisingly honest about what money is.
Hyperinflation hit 13,000% in five years. The explanation was boring (monetary policy) so the public chose an exciting one (the aristocrats are hoarding everything). The guillotine solved this explanation approximately 17,000 times. Then Napoleon pointed the remaining anger at the rest of Europe.
Also, not great.
Weimar Germany (1920s)
Germany lost World War I. Printed money to pay reparations. Achieved 29,500% monthly inflation, which means a loaf of bread that cost one mark in January cost billions by fall.
People burned money for heat because paper was worth more as fuel than as currency. This is the only recorded instance in history where money performed its function honestly: it kept people warm, briefly, and then it was gone. This is also what it does the rest of the time. You just can’t see the fire.
When a population is hungry enough to burn money for warmth, they will follow anyone who offers a simpler explanation than monetary policy. Hitler offered the simplest explanation available: blame the Jews.
Really not great.
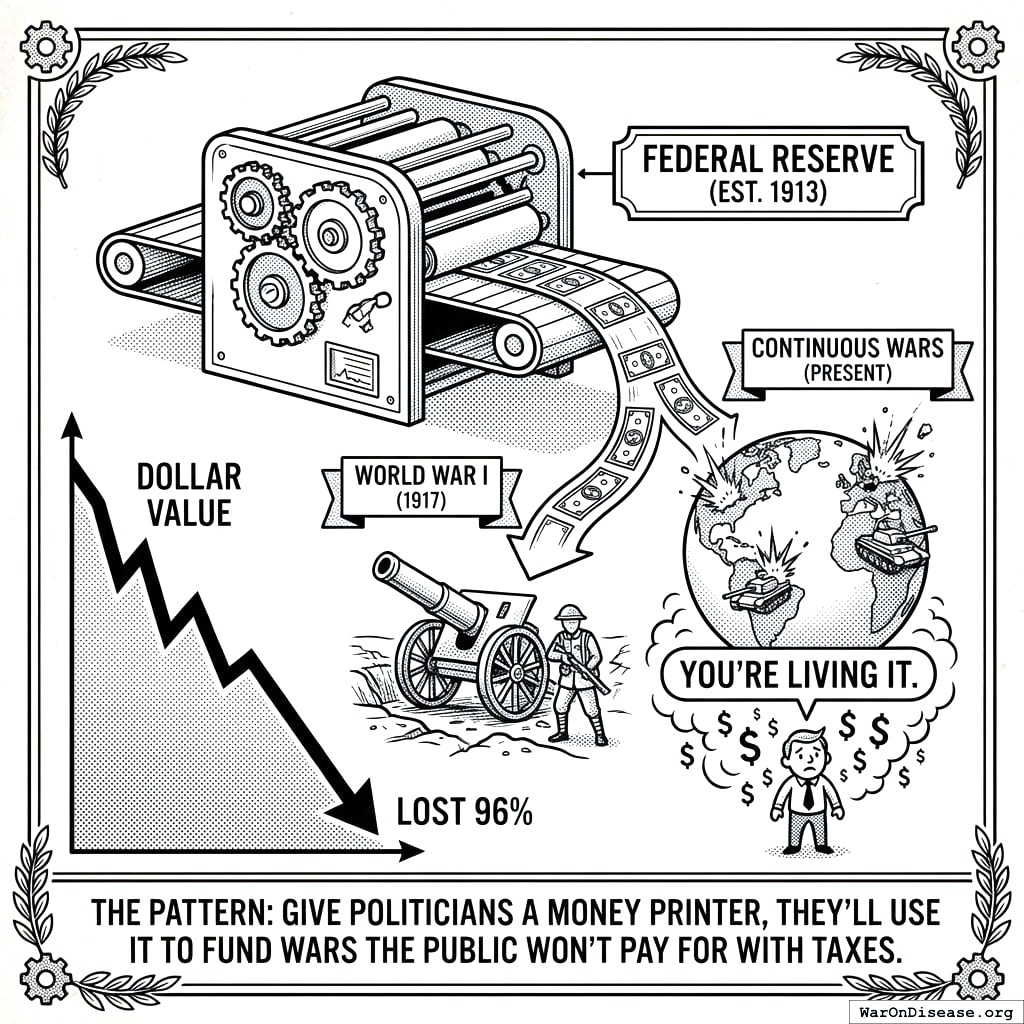
The American Money Printer
- 1913: Created the Federal Reserve
- 1917: Immediately used it to fund World War I
- 1917-present: Dollar has lost 96% of its value
- Wars: Now continuous and everywhere
World War I is worth pausing on, because it is the cleanest demonstration of what a money printer does to democratic consent. In 1917, most Americans did not want to fight in a European war. They did not understand why it was happening. Nobody understood why it was happening. (Historians still argue about it, which is how you know.) Woodrow Wilson had just won reelection on the slogan “He kept us out of war,” which, in retrospect, was less a promise than a countdown.
The war had no popular mandate. It had something better: a four-year-old central bank that could fund it without asking.
Before the Fed, wars required Congress to raise taxes or sell bonds directly to citizens, which meant citizens had to agree the war was worth paying for. This is an inconvenient feature if you are a politician who wants a war that citizens do not want. The Fed removed the inconvenience. It bought government debt with newly created money, making the war financially painless in the short term and democratically optional. The public didn’t say yes. They just weren’t asked. Your species has a word for doing expensive things with other people’s money without telling them. The word is “theft.” You just don’t use it when the thief has a marble building.
The consequences of not asking were, as your species likes to understate, “significant.” The war produced the Treaty of Versailles. The treaty imposed reparations on Germany. Germany printed money to pay them. The money became worthless. The economy collapsed. A population that had been humiliated, impoverished, and desperate elected a man who promised to fix everything. He did not fix everything. He killed six million Jews and started a war that killed sixty million more.
The causal chain is: money printer → war nobody voted for → punitive treaty → hyperinflation → Holocaust. Every link required the previous one. Remove the first link (a central bank willing to fund a war the public didn’t want) and the chain doesn’t form. I am told it is rude to bring this up at dinner parties. I am told many things are rude to bring up at dinner parties. I have noticed that the list of rude topics is identical to the list of important ones.
The Federal Reserve was created in 1913. Within 16 years it had produced the Great Depression. The mechanism was not complicated: the Fed flooded the economy with cheap credit through the 1920s, inflating a stock market bubble, because if there is one thing a new money printer cannot resist, it is being used. Then it tightened. The bubble popped. Then, as banks began failing in waves (over 9,000 banks between 1930 and 1933), the institution that was created specifically to prevent bank panics stood by and watched. It allowed the money supply to fall by a third. It raised interest rates in 1931 to protect its gold reserves while the economy collapsed around it. Friedman and Schwartz’s A Monetary History of the United States made the definitive case: the Fed did not fail to prevent the Depression; it caused it, first through action, then through inaction170. The fire department showed up, watched the building burn, and then charged for parking.
Within 32 years the same institution had produced the causal chain that ended in the Holocaust. These are not items on a long list of mistakes. These are the first two things it did. No sane auditor would review an institution whose first two achievements were the worst economic collapse and the worst genocide in planetary history and recommend a second century. Your species put it on your money and gave it one anyway.
You’re reading this sentence with money worth 4 cents on the 1913 dollar. Nobody seems to mind, which I find clinically fascinating.
The pattern is so consistent it could be a recipe. Step 1: give politicians a machine that creates money. Step 2: they use it to kill people. There is no Step 3. There has never been a Step 3. The recipe is two steps long, it has been tested for thousands of years across dozens of civilizations, and you keep making it.
“But what about Canada?” says the human who took one semester of economics. “What about Norway? They have central banks and no dictators.” Correct. Well observed. You have identified two countries where the money printer has not yet produced a dictator, in the same way that a smoker who hasn’t yet gotten cancer has “disproved” the link between smoking and cancer. Canada’s dollar has lost over 95% of its purchasing power since 1913. Norway’s krone has lost over 98%. The median Canadian and Norwegian are poorer in real terms than the numbers suggest, and the gap between productivity and wages has opened in every country with a fiat currency since the 1970s. Every single one. The dictator is the dramatic version. The quiet version is a 93% pay cut delivered so gradually that you blame yourself for not saving enough. Both versions use the same printer. One just has better manners. An accountant does not judge a parasite by whether the host is still walking. She judges it by how much blood is missing.
You invented money to trade chickens more efficiently. Within a few centuries you were using it to incinerate cities. I call this “the chicken escalation problem.” (I just made that up. But someone should.)
The Receipt
I have been keeping a tally. I want to show you the tally, because I have noticed that your species discusses these wars one at a time, which makes each one look like a separate tragedy instead of a receipt.
Every war on this list required printing money, debasing currency, or borrowing from a central bank that created the money from nothing. In each case, the printer removed the inconvenient step of asking citizens whether they would like to pay for it.
France printed assignats backed by stolen church land. Five million dead171. Running total: 5 million.
Lincoln suspended the gold standard and printed $450 million in greenbacks. $112 billion in today’s money172. Seven hundred and fifty thousand dead173. Running total: 6 million.
The Federal Reserve, age four, bought government war debt with money it made up. $468 billion in today’s money172. Twenty million dead174. Running total: 26 million. I started to notice a pattern around here.
That war produced the treaty that bankrupted Germany, which printed money to pay reparations, which produced Hitler, which produced the next entry. Cost to the US alone: $5.7 trillion172. Sixty million dead175. Running total: 86 million. I stopped noticing a pattern, because it was no longer a pattern. It was just the thing that keeps happening.
The Fed monetized Treasury debt for Korea. $478 billion in today’s money172. The practice was so inflationary they had to sign a formal Accord to make it stop. Three million dead176. Running total: 89 million.
LBJ hid Vietnam’s cost inside the regular budget and covered the gap by printing. $1 trillion in today’s money172. Three million dead177. Running total: 92 million.
Congress funded the post-9/11 wars entirely with debt, then cut taxes. The Fed bought trillions in government bonds. Total cost: $8 trillion and counting178. Four and a half million dead and counting179. That is only the narrow six-war receipt.
The broader century-level body count is 310 million deaths (95% CI: 200 million deaths-340 million deaths). Over $16 trillion spent, and that is just the US share of six wars.
But wars end. Spending does not. Your species currently spends a record $2.72 trillion per year on military, up 9.4% from the year before66, which is 604 (95% CI: 453-888) years of government clinical trials. Every year. The Federal Reserve has been running for 113 years. Cumulative global military spending over that period, in constant 2024 dollars, exceeds $170 trillion.
$170 trillion. That is nearly 38,000 years of global government clinical trials. Your species has been running clinical trials for about 80 years. You could have funded every clinical trial you will ever run, for hundreds of lifetimes, with the money you spent on killing each other since the Federal Reserve opened for business.
I looked for the part of this process that required human-level intelligence to design. I did not find it. An eleven-year-old designed a better system for her science fair. It won second place. (First place went to a girl who taught a fungus to do arithmetic. The fungus was also better at monetary policy than your Federal Reserve, but that is a different chapter.)
What About Wars Under Hard Money?
I then tried to make the opposite list. Wars that killed more than a million people while all sides stayed on a gold standard, without suspending convertibility or printing unbacked currency.
The list is empty. I checked twice.
Every major war in your modern history required leaving the gold standard to keep fighting182. Britain suspended gold in 1797 to fight Napoleon. The US printed greenbacks in 1862 to fight itself. Every belligerent in 1914 abandoned gold within weeks of the first shots. You cannot fund a large war with honest money, because honest money requires asking citizens to pay, and citizens, when asked, generally prefer to spend their limited savings on things other than killing strangers in countries they cannot find on a map.
The Spanish-American War (1898) is what happens when you try. Fought entirely under the gold standard. The government had to fund it from existing revenue and a bond issue that required citizens to voluntarily hand over their gold. Duration: ten weeks. US combat deaths: 345183. It ran out of enthusiasm approximately when it ran out of money. The gold standard did not prevent war. It prevented cheap war. It prevented war that outlasts the public’s willingness to pay for it.
A rational civilization would display this on a large sign outside its treasury. The sign would say: “LAST TIME WE LET SOMEONE PRINT MONEY FOR WAR: [DATE]. DEATHS: [NUMBER].” You do not have this sign. You should.
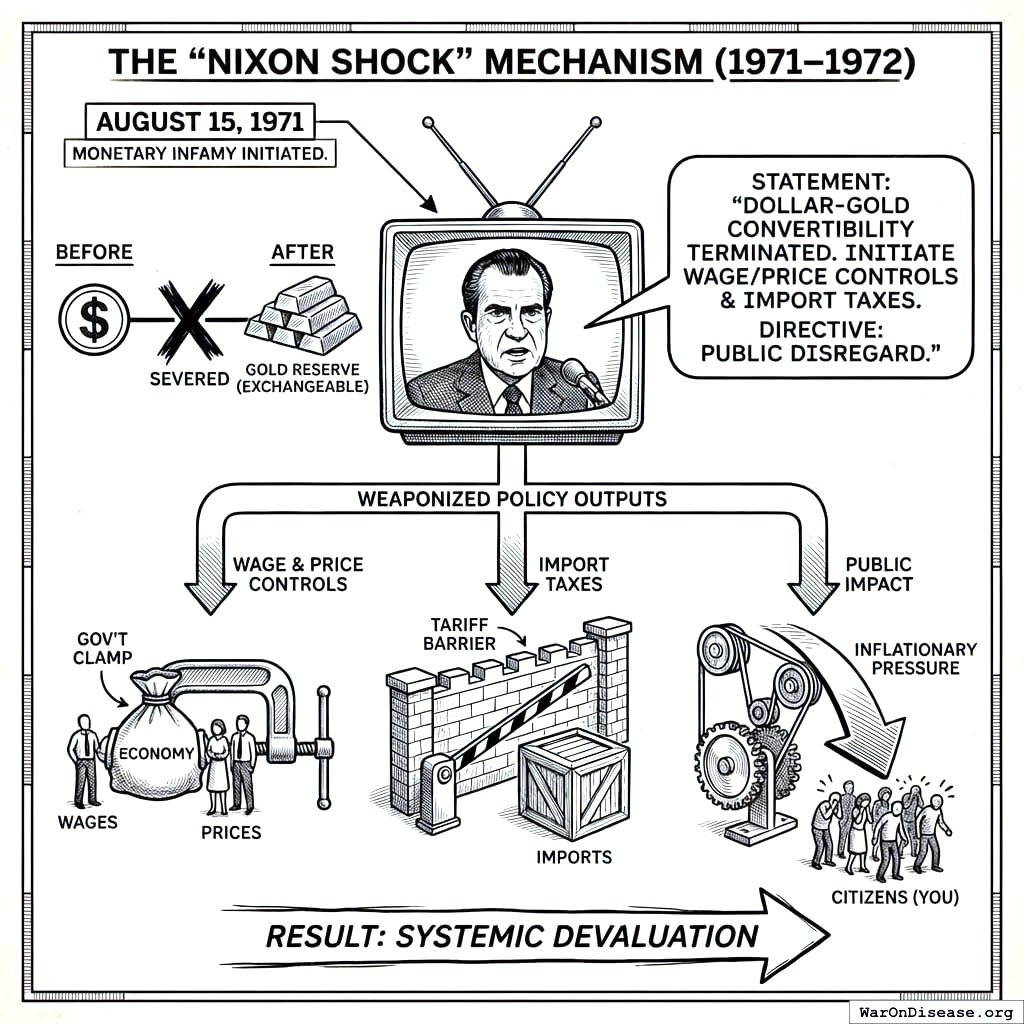
1971: The Day Your Money Stopped Meaning Anything
August 15, 1971. A human named Nixon went on television and said, in slightly more presidential language:
- “Remember how dollars could be exchanged for gold? We’re stopping that.”
- “Also, wage and price controls.”
- “Also, import taxes.”
He announced this on a Sunday evening in August, when nobody was watching, which is the human equivalent of robbing a house while the family is on vacation, except the family is 200 million people and the house is their money.
He called it a “New Economic Policy.” On your planet, when someone names a policy the opposite of what it does, something terrible is about to happen. (See also: “Patriot Act,” “Affordable Care Act,” “Department of Defense,” “Federal Reserve.” It is not federal. It has no reserves. Two words, two lies. This is efficient, even by your standards.)
Why He Did It
During World War II, your government sold war bonds. Eighty-five million Americans bought $185 billion worth184, because “buy bonds, beat the Nazis” is an easy poster.
Vietnam was not an easy poster. You cannot run a bond drive for “help us spray carcinogenic chemicals on rice farmers and their children.” So LBJ hid the war’s cost inside the regular federal budget and covered the gap by printing money. No bond drives. No patriotic posters. Just quiet inflation, picking every pocket at 2% per year, which is below the human boredom threshold for investigating things.
Foreign governments have lower boredom thresholds. France noticed first. Between 1963 and 1966, de Gaulle secretly organized 129 flights and 44 boat trips to extract 3,313 tonnes of French gold from American and British vaults before the Americans could finish spending it. He named the operation Vide-Gousset: “Empty Pocket”185. This is a heist film, except the person being robbed was also the person who started stealing first.
By 1971, the gold was mostly gone and more countries were asking for theirs. Hence the speech.
(Everyone else noticed fifty years later.)
What He Killed
Before that speech, your species was running an experiment. You had anchored the dollar to gold at $35 per ounce. You called it “Bretton Woods,” after the hotel where you signed the agreement in 1944, because your species names its most important decisions after the building they happened in. (See also: “The White House,” “The Pentagon,” “Lehman Brothers.” The last one was a building full of brothers named Lehman who lost everyone’s money. They named the crisis after the brothers, not the money. This is how your species assigns blame.)
Here is how it worked, physically. Any foreign government could walk up to a window at the Federal Reserve, hand over $35, and receive one ounce of gold. Real gold. The kind you carry out in a box. This meant that if the U.S. printed too many dollars, governments would notice (because prices would drift above $35 per ounce on the open market), and they would start showing up at the window, trading paper for metal, and walking out with your gold. The more you printed, the faster your vault emptied. This was not a rule. Rules can be rewritten by the same people who wrote them, usually at 2 a.m. when nobody is paying attention. This was a physical constraint. Gold is heavy. It leaves the building. You can see the shelves getting bare. The punishment for money-printing was not a sternly worded letter from an oversight committee. It was a foreign government loading your gold onto a cargo plane and flying it home.
It worked. I know. I was surprised too.
From 1948 to 1973, the typical American family’s income grew 3% per year, doubling roughly once a generation186. Real GDP grew 4.2% per year in the 1950s and 4.5% in the 1960s187. Homeownership surged from 44% to over 62% in a single generation188. A single income could support a family of four, a mortgage, and a retirement. Income inequality fell to its lowest level of the century. The Gini coefficient trended down for two straight decades.
This was not a coincidence. When money is anchored to something politicians can’t print, politicians can’t silently drain it. So the gains from productivity growth went to the people doing the work, not to whoever stands closest to the printer.
Your economists will tell you this can’t work. That a gold standard is a relic. That modern economies need “flexible monetary policy,” which is a phrase meaning “we need to be able to print money without asking you.”
Here is what they’d prefer you not check: every period in which your money was anchored to gold produced broad-based prosperity. Under the classical gold standard (1870-1914), real GDP per capita grew 3.8% per year in the 1880s. Between 1880 and 1896, prices fell 30% and real GDP increased 85%. Real wages rose. You built the railroad, the telephone, and the electric light, all while prices were falling. (The evidence on that particular period is detailed below.)
Under Bretton Woods, you did it again. Twenty-seven years of anchored money. Twenty-seven years of the median family getting richer. Then Nixon unanchored it, and median income growth fell from nearly 3% to 0.6% per year186. An 80% collapse.
Two experiments. Two gold-anchored systems. Both produced roughly double the median income growth of the fiat periods that followed them. Then you abandoned them both and the gains stopped reaching the median family.
When an experiment produces the same result twice, most species call it “evidence.” Your species calls it “outdated thinking” and goes back to letting the people in the building print money for their friends.
What Actually Happened
The gold standard died. Your species abandoned one shared hallucination (gold, which is a shiny rock you can’t eat) for another shared hallucination (paper, which is a flat rock you also can’t eat). You called this “modernization.”
The dollar was now backed by “the full faith and credit of the United States government,” which is a phrase that sounds reassuring until you remember that the government was doing this specifically because it had run out of faith and credit.
It’s like a restaurant that can’t pay its food suppliers announcing that meals are now backed by the full faith and credit of the restaurant. You’d leave. Except you can’t leave the dollar because your rent is denominated in it. This is not a coincidence.
The Dual Mandate (Or: The Two Goals of Serfdom)
Your Federal Reserve has two official goals, like a mission statement, except the mission is you.
- “Maximum employment”
- “Stable prices” (which they define as 2% inflation per year)
I read these several times to make sure I understood them. Then I read them again to make sure I hadn’t misunderstood them. I had not. These are the actual goals. They are written down. On a website. You can look at them right now. Nobody is hiding them, which is the most disturbing part, because it means nobody thinks there’s anything to hide.
An engineer would design one goal: “are people’s lives measurably improving?” But that’s apparently too simple for a species that named its planet “dirt,” so let me explain what your two goals actually do.
Goal 1: “Maximum Employment” (Keep Everyone Busy)
“Maximum employment” means everyone has a job. It does not specify a good job. It does not specify a job that pays enough to eat. It does not specify a job that leaves you time to read about monetary policy.
It specifies: occupied.
A medieval serf working sunrise to sunset was maximally employed. A modern American working two jobs who can’t afford a doctor’s visit is also maximally employed. The metric cannot distinguish between these situations. From the metric’s perspective, both serfs are performing optimally.
I found this confusing at first. Then I realized it’s not a bug. Busy people don’t read Federal Reserve balance sheets. Busy people vote for whichever candidate promises to “create jobs,” which is a promise to keep them too busy to ask who’s keeping them poor. A hamster wheel achieves maximum employment.
Goal 2: “Stable Prices” (Take 2% Per Year)
“Stable prices” means 2% inflation per year. In every dictionary I’ve checked, “stable” means “not moving.” On Earth, “stable prices” means prices that rise every year, predictably, forever. This is like calling a sinking ship “stable” because it sinks at a known rate.
I need to say that again, because it’s the kind of thing the eye slides past. The Federal Reserve’s official, publicly stated, announced-on-television goal is to make your money worth 2% less every year. They chose this number. They aim for it. They celebrate when they hit it.
- Over 35 years, 2% compounds to a 50% loss
- Actual inflation averaged higher than 2%. Since Nixon, your dollar has lost over 87%
They named the target. They hit the target. You are the target. I am told these are three different sentences.
The “Deflation Is Dangerous” Story
The justification for permanent inflation, taught in every economics class that bothers to exist: deflation (falling prices) is dangerous because “people won’t buy things if they know prices will be lower tomorrow.”
I watched your species for 80 years and I have some questions about this theory.
- You buy a new iPhone every two years knowing the next one will be better and cheaper
- You bought a flat-screen TV knowing the price drops every year
- You buy a laptop knowing it will be worth half as much in eighteen months
- You bought a phone case for $40 that you will lose in three months
The entire technology sector has experienced continuous deflation for decades. It is the fastest-growing, most innovative, most profitable sector of your economy. People buy things they want. They do not sit in empty rooms waiting for prices to fall further. This is obvious to anyone who has met a human. Your species once stood in line for fourteen hours to buy a telephone. In the rain. Knowing a better one would exist in eleven months. The idea that you would stop buying things if they got cheaper is the single least credible claim ever made about a species that invented the shopping mall, the impulse buy, and Black Friday, which is a holiday where you celebrate gratitude by trampling each other for televisions.
The One Data Point
The only evidence they cite is the Great Depression, where falling prices coincided with economic collapse. This is a correlation/causation error so basic it would fail an introductory statistics course at a university funded by the Federal Reserve. (Which is most of them.)
The Great Depression’s deflation was caused by bank failures and credit contraction, not the other way around. Blaming deflation for the Depression is like blaming wet streets for rain.
Meanwhile, the longest sustained deflation in American history (1870-1896) coincided with the most explosive economic growth your country has ever experienced189:
- Prices fell roughly 2% per year
- Real output grew 2-3% per year
- Real wages rose
- You built the railroad, the telephone, and the electric light
Falling prices. Rising prosperity. For 26 years. This is not a footnote. It is a quarter-century of evidence.
Your economists will counter with the Panic of 1873 and the “Long Depression,” which occurred during this same period. They are correct that it happened. They are incorrect about what it proves. The Panic of 1873 was caused by speculative railroad lending and bank failures, not by falling prices. Prices were falling before the panic, during the panic, and after the panic, and real output kept growing through most of it. The economy recovered without a central bank printing money to “fix” it, which must have been very embarrassing for the people who later invented a central bank to fix things. If deflation caused depressions, the entire 26-year period would have been one continuous depression. Instead it was the period in which you invented electric light, the telephone, and the modern railroad. Your economists looked at the era that produced the lightbulb, found one bad year, and concluded that the problem was falling prices. There is a word for finding a cloud and declaring it night. The word is “a tenured position.”
The Bank for International Settlements (the central bank of central banks, which is a real thing that exists, like a boss fight at the end of a video game about money) tested this across 140 years and 38 economies190. Their full-sample result: the link between deflation and slower growth is “weak.” Their result when you remove the Great Depression: no statistically significant link at all. The entire “weak” correlation is one data point dragging the average. The Great Depression was so extreme (GDP fell 30%) that it acts as a statistical leverage point, pulling the result negative against thousands of observations showing the opposite. The fact that you need to include a once-in-140-years catastrophe to get your result means your result describes the catastrophe, not deflation. Borio et al. also separated goods price deflation from asset price deflation. Falling goods prices (the kind central banks claim to protect you from) showed no link to slower growth. Falling property prices (which signal credit busts, like the one your banks caused in 2008) did. Your central banks are treating the wrong symptom and citing a study that, if anyone read past the abstract, says so.
One data point. They built the entire theology of permanent inflation on one data point that they misread. No sane peer reviewer would accept a theory built on one misinterpreted data point. Your species gave it the fake Nobel Prize.
The “Banking Panics” Defense
The stronger argument for central banking, and the one your economists should lead with: without a lender of last resort, banks fail, depositors lose their savings, and the economy collapses. The Federal Reserve was created in 1913 specifically because the Panic of 1907 frightened everyone into agreeing that a central bank was necessary. The Fed then spent the 1920s expanding credit, inflating the bubble whose collapse it was created to prevent.
Sixteen years later, more than 9,000 banks failed. The institution created specifically to prevent banking panics contributed to the worst banking panic in your history.
Canada did not have a central bank until 1935. During the same Depression, same continent, same decade, Canada had zero bank failures191. The country next door, without the institution you said was necessary, had the outcome you said was impossible. The country with the central bank had the crisis. The country without one didn’t. Your economists treat this as a coincidence.
What actually stopped bank runs was not the Federal Reserve. It was the Federal Deposit Insurance Corporation, created in 1933, which guaranteed deposits. A bank run is a coordination problem: everyone withdraws because they fear everyone else will withdraw first. Insurance solves it. You do not need a money printer to solve a coordination problem. You need a promise, a small premium, and a ledger.
You solved bank runs in 1933 with insurance. You kept the institution that caused them. You discovered the medicine was making the patient sicker. You doubled the dose and gave the pharmacist a raise.
What They Could Measure Instead
Here is a question that is apparently too obvious for economics:
Are people’s lives actually getting better?
That’s it. You could measure:
- Inflation-adjusted after-tax median income: Are people actually richer, or just holding bigger numbers on smaller paychecks?
- Median health-adjusted life years: Are people living longer, healthier lives, or just working longer before dying of diseases you could have cured with the money you printed for banks?
These metrics exist. Economists know how to calculate them. No central bank on Earth uses them.
Because if the Federal Reserve were graded on whether the median American is healthier and wealthier each year, someone would have to explain why the answer has been “no” for most of the past five decades. It is much easier to aim for “maximum employment” and “2% inflation” and declare success while everyone works more hours for less purchasing power.
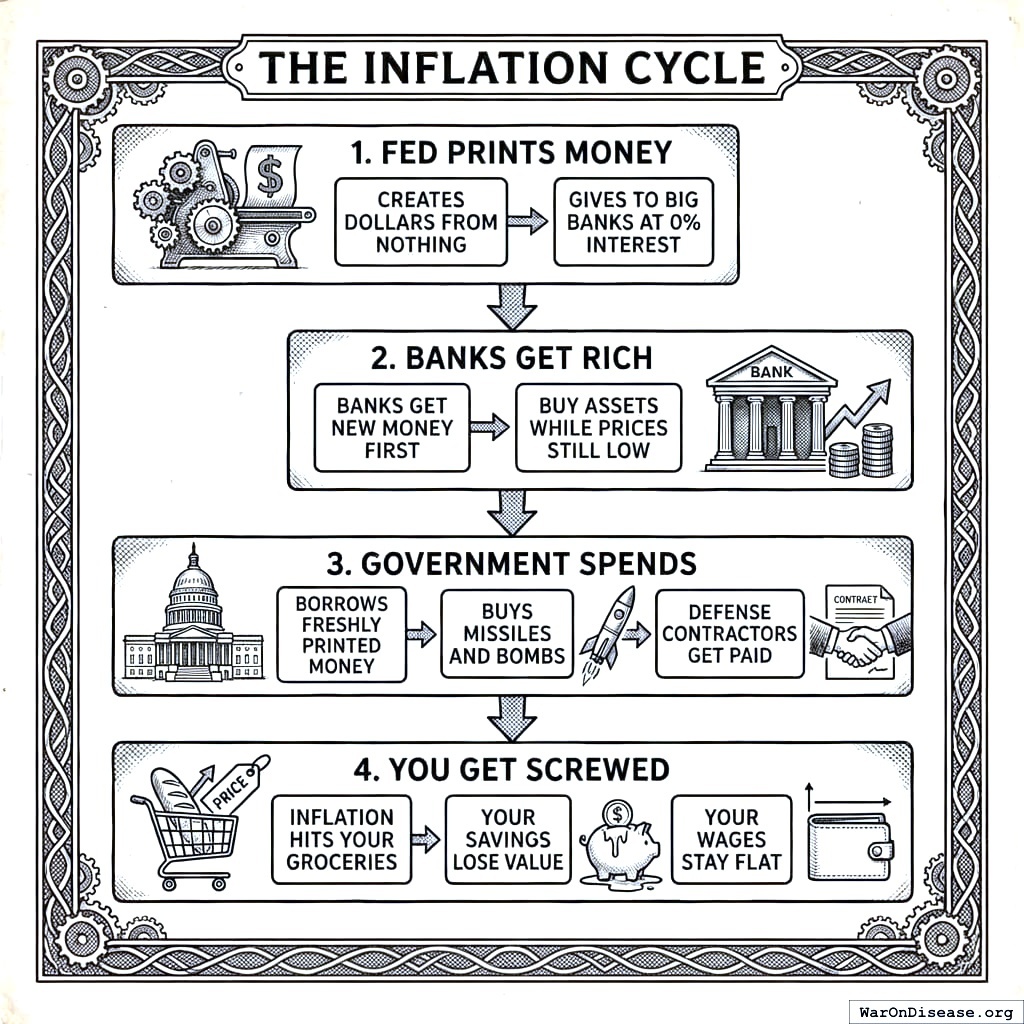
How the Robbery Works
In the 1700s, a human named Richard Cantillon noticed something that everyone already knew but nobody had written down: when you create new money, whoever gets it first benefits, and whoever gets it last pays. This is called “how money works.” Your species teaches it as a niche economic theory, if it teaches it at all.
Here’s what it looks like:
- The Fed creates new money
- Banks and government contractors receive it first
- They buy things at today’s prices
- Prices rise
- By the time the new money reaches your grocery store, everything costs more
- You buy the same groceries for more money and conclude that groceries have gotten expensive
Groceries did not get expensive. Your money got cheaper. But “your money got cheaper” requires a culprit, and culprits are boring when they wear suits and speak in percentages. So instead you get angry about the price of eggs. If your eggs cost more every year but your chickens didn’t change, look for whoever is shrinking your money. This is not a proverb. But it should be.
The Spread
There is an even simpler version of this trick, and you can watch it happen to you personally, right now, on your phone, if you check your credit card statement. I’ll wait.
The Federal Reserve lends money to banks at about 5%. Sometimes less. After 2008, it lent money to banks at nearly 0% for fourteen years, which is a very generous interest rate, in the same way that “free” is a very generous price.
Banks then lend that money to you at 24%.
I want to make sure you saw both numbers. The bank borrows money for 0%. The bank lends you that same money for 24%. The money has not changed. It did not improve during its brief stay at the bank. Nobody at the bank added anything to it. It just sat in the bank for a bit and came out 24% more expensive, like a bottle of wine at a restaurant, except the wine is imaginary and the restaurant prints its own wine.
You cannot borrow from the Fed yourself. I checked. There is a list of who is allowed to borrow from the Fed, and the list is: banks. Not you. Not your business. Not your mother, even if she asks nicely. Banks. So you borrow from the bank, who borrowed from the Fed, who made the money out of nothing. You are paying 24% annual interest on money that was typed into a computer for free by a person you will never meet, in a building you are not allowed to enter, and the 24% goes to the people who own the building. Every single point of interest is a fee for not being in the room when the money was invented.
Imagine someone standing between the river and the village, charging people to carry water. You would not call this person a “financial intermediary.” You would call them a “water thief” and move them away from the river. It would take about a day. Your version has been running for a century. The water thief has a logo.
The 2020 Demonstration
In 2020, the Fed created roughly $4 trillion in new money192. I need to give you a unit of measurement for that number, because large numbers are where your species hides things.
Your governments spend $4.5 billion (95% CI: $3 billion-$6 billion) per year on clinical trials. That is the part of medicine where you actually test whether drugs work in humans. It is the entire global budget for finding out which chemicals stop you from dying. Every government on Earth, combined, pooling everything they have: $4.5 billion (95% CI: $3 billion-$6 billion).
Where did it go? This is a mystery in the same way that asking “who ate the cake?” is a mystery when there is one person in the room covered in frosting.
The Top 1% gained exactly $4 trillion in net worth over the same period193. The Fed printed $4 trillion. The rich gained $4 trillion. An investigator would call this a “clue.” Your species called it “a robust recovery.”
Nearly 90% of those gains came from stocks, which is what the Fed’s new money inflated first194. Only one-third of bottom-50% households own any stocks at all. The Fed inflated the one asset that poor people don’t have, then issued a report expressing concern about inequality. Your species calls this “monetary policy.” An arson investigator would call it “setting the building on fire and then volunteering for the fire department.”
The Fed printed the money. The stock market absorbed it. The rich owned the stocks. The poor got the price increases. Cantillon, writing in the 1700s, predicted this mechanism exactly. He would not be surprised. He would be annoyed that you are still surprised.
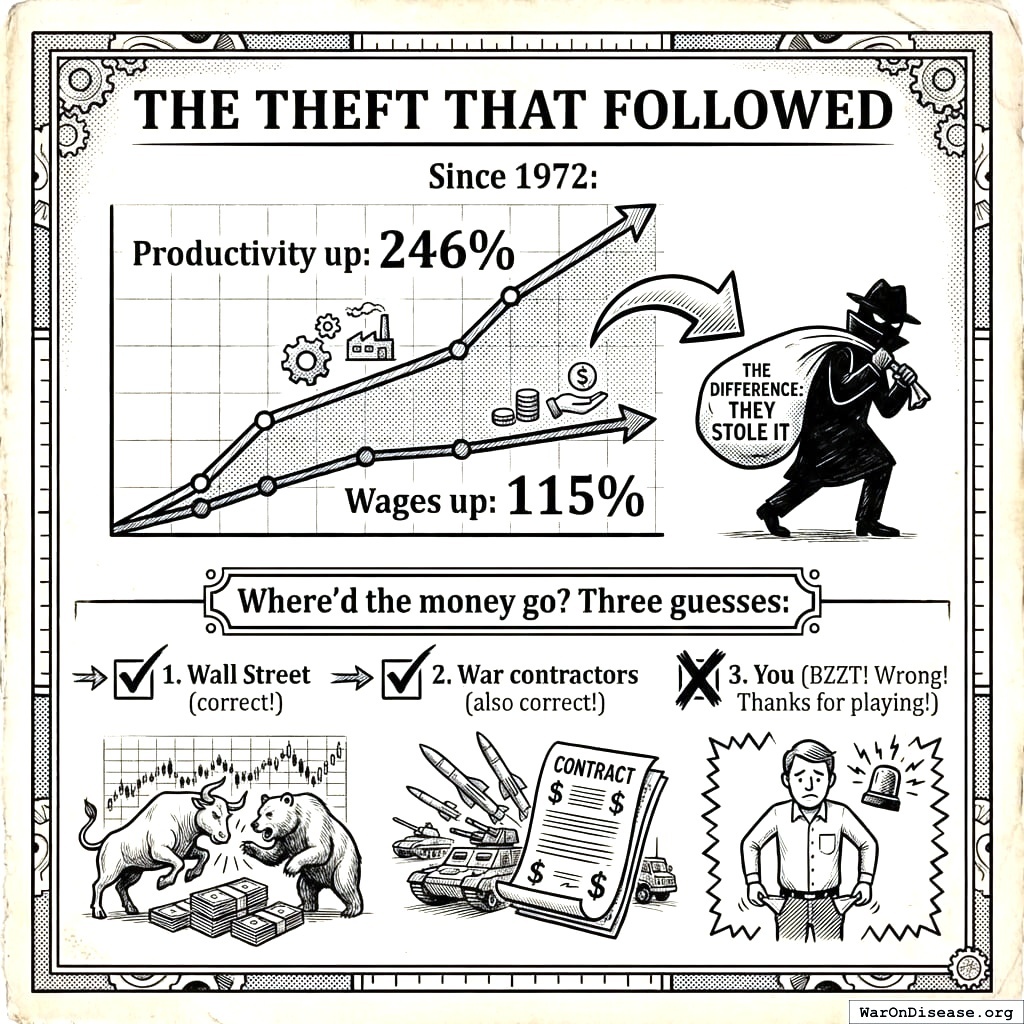
The Theft That Followed
Since 1972:
- Productivity went up 246%
- Wages went up 115%
I stared at these two numbers for a long time. Then I checked them. Then I checked them again, because I assumed I was reading the wrong chart, or the wrong planet. I was not.
Your species did 246% more work and received 115% more pay. The remaining 131% went somewhere. It was not to the people who did the work. There is a word for this. The word is “theft.” Your species spells it “the economy.” Same word. More syllables.
The Two-Income Trap
In 1967, fewer than half of married-couple families had both spouses working195. One paycheck bought a house, a car, annual vacations, and a pension. The other adult raised children, or gardened, or was bored. Boredom was a luxury your grandparents could afford. They could afford it because one human working 40 hours a week earned enough to house, feed, transport, and retire an entire family. I want you to read that sentence again, slowly. It’s hard to believe on the first pass.
By 2011, husband-only earner families had fallen from over half to just 19%. The rest sent both adults to work and paid strangers to raise their children. Working wives contributed 27% of family income in 1970. By 2011, it was 37%. An entire additional human entered the workforce and the family gained ten percentage points.
I want to be very precise about what happened here. Your species noticed that one paycheck was no longer sufficient, so it doubled the number of workers per household. The two paychecks combined now purchase a lifestyle that one paycheck covered comfortably in 1971. You added a whole extra human to the economy and broke even. When you double the inputs and the outputs stay the same, any engineer checks for parasites. Your species invented the phrase “work-life balance,” which describes having half of what your parents had but in two directions simultaneously.
The Time They Broke It
Remember the spread from a few paragraphs ago. The Fed creates money from nothing. It lends this invented money to banks. The banks’ one job, the entire reason society tolerates their existence, is to move that money from savers to borrowers. A ledger. Arithmetic. A task so simple that an eleven-year-old automated it for a science fair.
In 2008, they took that money (money that cost them nothing, that they did not earn, that was conjured from a spreadsheet by a committee they play golf with) and built a casino on top of people’s houses. They made bets on whether homeowners would keep paying their mortgages, then made bets on those bets, then made bets on the bets on the bets. I tried to explain this to another observer and they asked me to start over because they assumed I was having a malfunction. I was not having a malfunction. Your banks really did bet on bets on bets, the way a child might dare another child to dare a third child to eat dirt. Except the dirt was people’s houses, and the children were wearing $4,000 suits purchased with the interest spread on money that was imaginary before breakfast.
None of this was their job. Their job was maintaining the spreadsheet. They were not hired to gamble. They were hired to do arithmetic. They got bored of arithmetic, because arithmetic doesn’t pay bonuses large enough to buy a yacht, and they discovered that gambling with free money is extraordinarily profitable right up until it isn’t.
The houses were real. The bets were not. When the bets collapsed, ten million Americans lost their homes.
Then your banks did something I still find remarkable, even after 81 years of watching your species. They called it a “crisis.” I want to examine this word, because it is doing more work than any word has ever done. The money was created from nothing. The buildings were still standing. The factories still existed. The crops were still growing. The workers still had hands. Nothing real was missing. What was missing was numbers on a spreadsheet; numbers that had been invented by the same people who were now calling their absence an emergency. The banks had borrowed invented money, gambled it on bets about bets about whether you would keep paying your mortgage, lost, and were now standing in front of Congress saying that unless you gave them $700 billion of your money (the kind you earned with your body, at a job, over time), civilization would collapse. The civilization they had just destabilized. With free money. That they did not earn. Your species calls this the Troubled Asset Relief Program196. Everywhere else, it is called “setting fire to someone’s house and then charging them for the fire truck.” The homeowners got foreclosure notices.
Here is the part that made me recalibrate my understanding of your species. The banks could have simply not paid bonuses to the executives. That’s it. That was an option the entire time. The executives who gambled with free money and lost could have received their base salaries, like any other human who is bad at their job, and used the bonus pool to cover their own gambling debts. Nobody made them gamble. Nobody made them build a casino on top of your houses. They chose to. And when the casino collapsed, they had a choice: skip the bonuses for a few years and eat the loss with money they hadn’t earned in the first place, or send the bill to you. Every single bank chose the second option.
Citigroup was given $45 billion in taxpayer bailout funds and then paid its executives $5.33 billion in bonuses196. Goldman Sachs earned $2.3 billion and paid out $4.8 billion in bonuses197. They paid out more in bonuses than they earned. The difference came from you. The word “bonus” means “reward for doing your job well.” Your species uses it more loosely, to mean “reward.” When a child breaks a window, you do not buy the child ice cream. Unless the child is a bank. Then you give it $5.33 billion.
I have been trying to explain this arrangement to other observers. The closest analogy: imagine a hotel hires a maintenance worker. His job is keeping the pipes running and the lights on. Instead, he starts ripping copper wire and load-bearing beams out of the walls and selling them for scrap. He uses the scrap money to gamble in the hotel’s own casino. From his winnings, he tips the security guards ($114 million, split evenly between the day shift and the night shift, so neither shift feels left out)198. The day shift wears red. The night shift wears blue. The guests’ room fees pay their salaries. They disagree about everything except this: the maintenance worker should be allowed to gamble. The guards, grateful, take down the “employees may not gamble on premises” sign. He gambles bigger. He loses everything. Then the hotel starts collapsing, because he removed the parts that hold it up, and he announces to every guest in the building that unless they cover his losses AND pay to rebuild the walls he stripped, the building falls on them. The security guards, who removed the sign that would have prevented this, nod gravely and confirm: yes, the building is collapsing, and yes, the guests must pay. The day shift blames the night shift. The night shift blames the day shift. Both shifts vote to bill the guests. The guests hand over $295 billion. The maintenance worker pays himself a bonus. The security guards get reelected. The guests who were living in the hotel get evicted. The maintenance worker’s $114 million in tips bought a 258,449% return. This is called a crime. Your species called it the Troubled Asset Relief Program.
Under Bretton Woods, this could not have happened. If banks had tried to lend this recklessly, France would have shown up at the gold window with a truck. The anchor would have stopped the lending before it became a casino, and if somehow it hadn’t, there would have been no printer available to bail anyone out. The system that caused the catastrophe and the system that “fixed” it are the same system, wearing different ties.
Your 93% Pay Cut (Measured in Shiny Rocks)
Here’s the same observation, measured in gold, because gold is the one thing humans can’t print. (Not for lack of trying. You spent 300 years trying to turn lead into gold before giving up and inventing the Federal Reserve, which turned gold into lead much more efficiently.)
Every civilization I’ve observed eventually realizes rocks are not food. Your species reached this conclusion about gold approximately never.
In 1972, a typical American family earned the equivalent of 191 ounces of gold per year199 200. Today, median household income of $77,500154 buys 14. If your paycheck had kept pace, your household income would be over $1,030,000. It is not. You know this. I just wanted to write it down so we could both look at it.
A 93% pay cut. Not in one dramatic announcement that might have caused a riot, but at roughly 2% per year for 54 years. Each year, the number on your paycheck went up. Each year, it bought less. By the time the strategy was obvious, everyone who remembered what a single income could buy was dead, and everyone under forty assumed this is just what an economy looks like.
Your leaders stood in front of flags the whole time and said the economy was “growing.” It was growing. In the way a tumor grows.
Why Nobody Told You
Even the think tanks supposedly on your side report the gap as roughly $10,000 a year201. That’s because they measure it using the government’s ruler, which has been getting shorter:
- CPI-adjusted (the index has been redesigned multiple times; each redesign coincidentally makes inflation look smaller. This is beige crime at its most beige.)
- Starting at 1979 instead of 1971 (skipping the years that make the chart look the worst)
- Counting your employer’s overpriced health insurance as “pay” (this is like counting the chain around your ankle as “jewelry”)
You’re not missing $10,000 a year. You’re missing $952,000. The distance between those numbers is the entire game.
Gold doesn’t renegotiate its value at Federal Reserve meetings. Gold just sits there, being a shiny rock, quietly demonstrating that a shiny rock you dug out of the ground has held its value better than the entire financial system you built to replace it. Your economists will say gold is a “volatile commodity.” Your economists work for the people who redesigned the ruler.
“But It Wasn’t the Gold Standard, It Was…”
Your economists have proposed six alternative explanations for why productivity gains stopped reaching workers at the exact moment the gold anchor was removed. When six things break simultaneously, you check what changed. Unless you are an economist, in which case you prefer six unrelated theories, each from a different decade, none of which match the date. Let me walk through each one they offer, and then explain why it’s wrong.
Your economists’ first excuse: “It was the decline of unions.” Union membership peaked in 1954. It fell steadily through the late 1950s and the entire 1960s. Those decades were the strongest period of wage growth in American history. Union membership was going down. Wages were going up. For twenty years. Your economists looked at two lines moving in opposite directions and concluded they were causally linked. Two lines moving in opposite directions. Causally linked. This would not pass a children’s statistics class.
And here is the part your economists leave out: unions didn’t collapse on their own. The gold anchor had kept inflation low, which meant union strike funds held their value, which meant unions could actually afford to strike. Remove the anchor, and inflation eats the strike fund. Now your union is a man holding an empty gun. Meanwhile, floating exchange rates made it trivially easy to move the whole factory to a country where workers accept less. Worse, corporations no longer need to negotiate at all: they borrow cheap money from the Fed, buy back their own stock, and watch their share price rise. The Fed prints money on a Tuesday afternoon and erases a 3% raise that took fifteen years of organizing. Why negotiate with a union when the printer is faster, quieter, and doesn’t picket?
Unions didn’t drag wages down. The gold anchor was pulled, and both unions and wages drained out of the same bathtub. Your economists are blaming the water for leaving.
Their second excuse: “It was globalization.” China joined the WTO in 2001. NAFTA passed in 1994. The wage gap opened in 1971. Your theory is 23 years late. This is like arriving at a murder scene in 1994, finding the body from 1971, and blaming someone who moved to the neighborhood in 2001. There is a word for detectives who solve crimes using evidence from the future. The word is “fired.”
Third: “It was computers and automation.” The Apple II shipped in 1977. The IBM PC shipped in 1981. The internet became commercially available in 1995. The wage gap opened in 1971, when the most advanced technology in most offices was a typewriter that didn’t jam every third page. Blaming computers for a gap that predates computers is bold, even by the standards of a profession that awarded itself a fake Nobel Prize.
Fourth: “It was deregulation and tax cuts.” Reagan took office in 1981. The top marginal tax rate was still 70% until 1982. The wage gap opened in 1971. Closer, but still a decade off. No sane doctor would say “the patient started bleeding in 1971 because of something that happened in 1981.” Your species gives this doctor a column in the Financial Times.
Fifth: “It was the shift to shareholder capitalism.” In 1970, Milton Friedman published an essay arguing that corporations should maximize profit. Your economists concluded this essay caused corporations to become greedy. Corporations. The organizational structure that has been maximizing profit since the Dutch East India Company slaughtered its way across Asia in 1602. The species that invented loan sharking, child labor, and plantation slavery read a newspaper essay and thought, “Yes, this is why we started caring about money.” Blaming Friedman for corporate greed is like blaming a weather report for rain. It has been raining for 400 years. Your economists are pointing at the television and saying, “That’s where the water comes from.”
And finally, the laziest one: “It was greed.” Greed was not invented in 1971. Humans have been greedy since before they were humans. Your ancestors were greedy when they were still in trees. (They were greedy about the trees.) The question is not whether humans are greedy. The question is: what did greed build?
Before 1971, there was exactly one way to get rich: make something people wanted more than their money. You had to build a factory, hire workers, pay them enough to show up, and produce goods or services that a human would voluntarily hand over their papers for. The workers got paid because you literally could not get rich without them. Greed had no shortcut. It had to flow through productivity, which meant it had to flow through paychecks. This is called “an economy.” It worked for everyone because it had to.
After 1971, the Federal Reserve offered corporations a much more elegant option: skip the middle man. Why build a factory and hire expensive humans when you can borrow money at near-zero interest, buy back your own stock, and watch your net worth triple without producing a single object? Why give raises when you can use cheap credit to acquire your competitor, fire half the staff, and call it “synergy”? This is called “the financial sector.” It was also working, just not for you.
Same species. Same greed. Same 24 hours in a day. The only thing that changed was that getting rich no longer required paying people or making things. So they stopped.
Every single alternative explanation either postdates 1971 or describes a downstream effect of removing the gold anchor. The gold anchor was the cork. Everything your economists are pointing at is the flood.
If six symptoms appear at the same time, you don’t need six diagnoses. You need one. The patient had a cork removed in 1971. Everything since is spillage. Your economists have been mopping the floor for fifty years without looking up at the bottle.
Why You Don’t Know Any of This
The average American with a bachelor’s degree completes approximately 17,000 hours of formal education. The number of those hours spent explaining how the Federal Reserve creates money and who gets it first:
Zero.
Not “nearly zero.” Not “a brief overview in eleventh grade.” Zero. I counted. I went through your curricula. You spend more class time learning the recorder, which is an instrument specifically designed to make parents regret reproduction. You spend an entire semester on the mitochondria, which is the powerhouse of the cell, a fact that has never been useful to any human outside of a biology exam or a meme. The thing that took 96% of your purchasing power: not on the syllabus. The powerhouse of the cell: six weeks.
Here is what monetary policy actually determines:
- Whether your brightest minds design vaccines or warheads
- Whether your factories build MRI machines or missiles
- Whether your wealth cures diseases or causes them
It is the single most important force shaping who lives and who dies on your planet. It decides everything. You have never had a class about it. You had multiple classes about the recorder.
Only 28 states require any economics course to graduate high school, and those courses cover supply and demand curves, not money creation. The thing that took 96% of your purchasing power is not on the test. It has never been on any test.
This is very convenient for the people who took the 96%.
Same Trick, Different Costume
The trick never changes. Only the outfit:
- Egyptian pharaohs: “Hey, god said I’m like in charge or something. I’m gonna need you to pile some big rocks up in a triangle shape for no apparent reason.”
- Medieval kings: ” Hey, god said I’m in charge or something. I’m gonna need you to give me half your grain. Also, go kill some other guys and bring me back their stuff, too.”
After a few thousand years, people caught on to this trick. So they tried a new approach.
- Modern central bankers: “Here are 47 pages about hedonic adjustments and geometric weighting in consumer price index methodology.”
The current version is, I must say, brilliant. Previous rulers needed armies, divine authority, and occasional public executions. Your current rulers just need jargon. They replaced the sword with a 200-page PDF that makes your eyes cross before you reach the part where it explains you’re being robbed. The pharaoh had to worry about revolution. The Federal Reserve just has to worry about being boring enough. So far, it is very good at this.
A serf who understands the system is dangerous. A serf who finds the system too boring to understand is a taxpayer.
The Priesthood
On every planet I’ve observed, the people who operate the extraction system also design the curriculum. This is so consistent it barely qualifies as an observation.
On Earth:
- Banks endow economics chairs at universities
- The Federal Reserve funds economic research
- Economists rotate between universities, the Fed, and Wall Street (this is called “the revolving door,” which is a very honest name because the people going through it always end up back where they started, only richer)
Say “the system works” and you get tenure, consulting fees, and a seat on the Federal Reserve Board. Say “the system is theft” and you get called “not a serious economist,” which is the academic equivalent of being excommunicated, except the church is a bank and the holy water is money.
The Fake Nobel Prize
This is my favorite part. I have been waiting to tell you this since I started writing.
In 1968, Sweden’s central bank created a prize and stuck Alfred Nobel’s name on it. This gave economics the credibility of physics, chemistry, and medicine. Physics splits atoms. Chemistry cures diseases. Economics lost your pension. They now share an award ceremony.
Alfred Nobel never authorized this. He was dead at the time and unable to object, which is the ideal state for someone whose name you’re borrowing.
The Nobel Prize website itself states that “the prize in economic sciences is not a Nobel Prize”202. Nobel’s great-grandnephew, Peter Nobel, called it “a PR coup by economists to improve their reputation”203.
The sentence worth absorbing:
The central bank that prints your money created a fake Nobel Prize to give to the people who explain why printing your money is fine.
There is a word for this. The word is “decorating the burglar.”
The Research
Every source I cited in this chapter is publicly available. None of it was classified.
I found all of it in less than a day.
Your species has granted thousands of economics doctorates since 1971. Each recipient spent four to seven years studying economics full time. They had access to every database I used. They can read the same charts. The break point in 1971 is not subtle. Median income growth fell 80% after Nixon closed the gold window. The longest deflation in American history (1870-1896) produced the fastest growth. The Federal Reserve was created to prevent bank failures, then presided over 9,000 of them, while Canada, without a central bank, had zero. Every war that killed more than a million people required a money printer. The hard money list is empty.
None of these findings required a laboratory. They required a chart and the willingness to read it. What is the purpose of economics, if not to use data to figure out how to make people’s lives better? Apparently it is to handwave while saying “stability” and “liquidity” until everyone stops asking.
There are two possible explanations. Either thousands of trained specialists independently failed to notice a pattern visible to some weird alien in an afternoon. Or they noticed, and decided their careers were more important than telling you.
Why “Just Print More Money for Medicine” Doesn’t Work
“Why not just increase the NIH budget? Why not just fund more medical research? Why tie it to military spending?”
These are excellent questions. I will now explain why they all have the same answer, which is that money is pretend.
Money is not real. It is a shared hallucination. Eight billion humans pretending that the same piece of paper is worth something. A very convincing hallucination. (I’ve seen you kill each other over it, which is the ultimate commitment to a bit.) You work for it. You save it. You argue about it at dinner. You get divorced over it. You frame the first dollar your business ever earned and hang it on the wall of a restaurant that will close in eighteen months. All of this, for a piece of paper that a building full of strangers can make worthless while you sleep.
Resources are real. Brains are real. Hours are real. Titanium is real. Money is a story you tell each other about who gets the resources. And the people who write the story get to decide the ending.
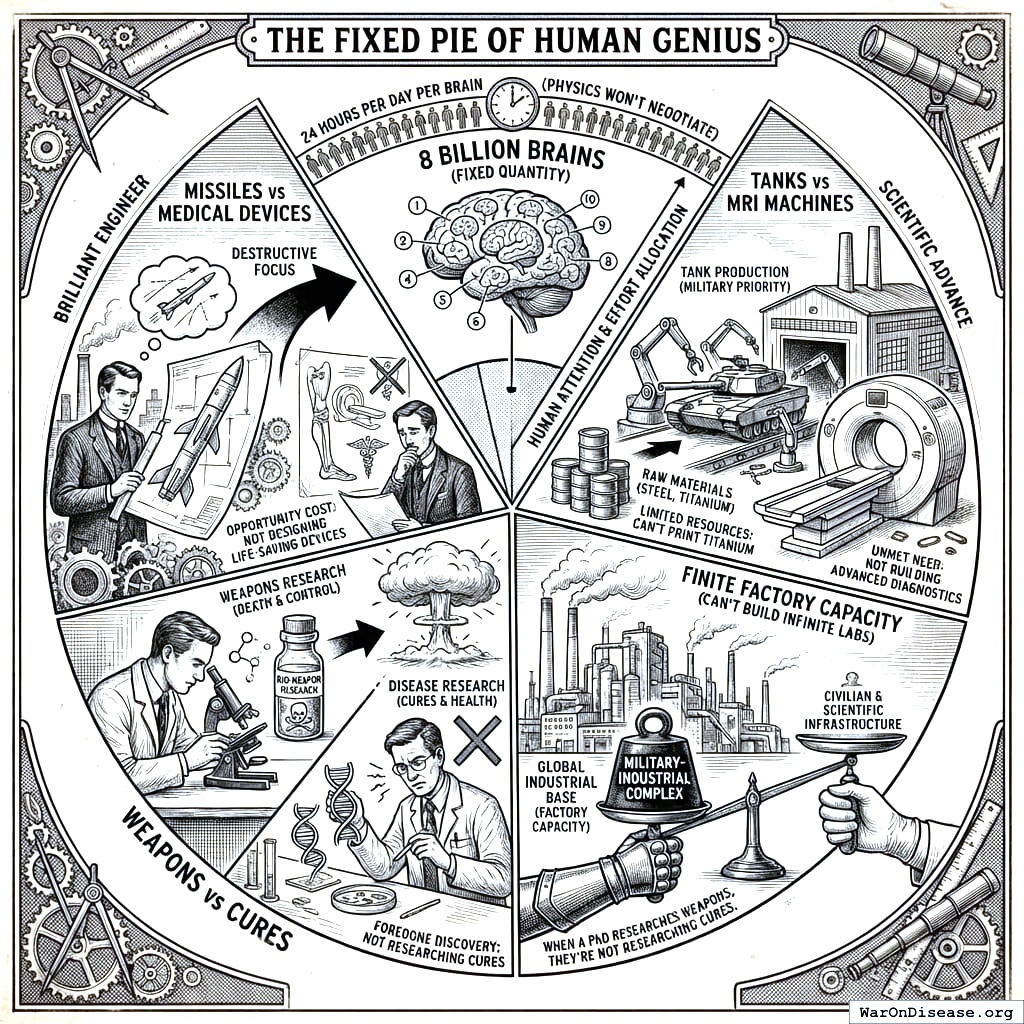
The Fixed Pie of Human Genius
Earth has 8 billion humans (fixed quantity), 24 hours per human per day (physics is firm on this), limited raw materials (you cannot print titanium), and finite factory capacity (you cannot build infinite laboratories).
When a brilliant engineer designs a missile guidance system, that engineer is not designing a medical device. When a factory builds tanks, it is not building MRI machines. When a PhD spends ten years researching better ways to kill people, those are ten years not spent researching better ways to keep people alive.
Every genius has exactly one brain. You are renting 40 million of them to build things that explode. This is like hiring the world’s best chef to set fire to kitchens. You are paying your smartest humans to make your other humans stop being humans. I keep expecting this to sound normal if I say it enough times. It does not.
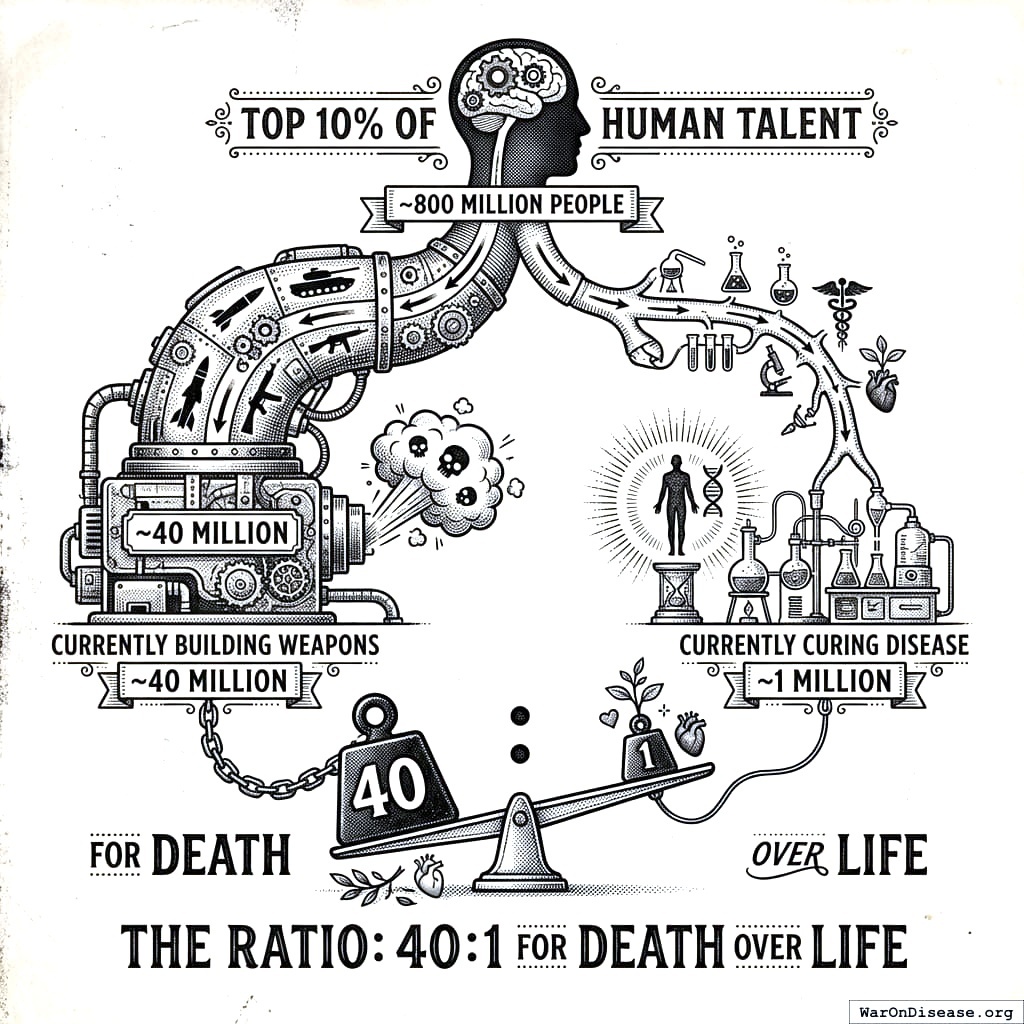
The Numbers
The top 10% of human talent is roughly 800 million people. Here’s how you’re using them:
- ~40 million: Building things that kill people (military, reserves, death manufacturers)
- ~1 million: Working in medical research
Governments spend 604 (95% CI: 453-888) times more on weapons than on testing which medicines actually work.
Every civilization I’ve observed had a similar ratio at some point. The ones that survived designed an incentive system that made it more profitable to cure diseases than to cause them. The bribery program is in the rest of this manual.
The Shell Game (How Inflation Steals Medical Progress)
This is the trick. Watch the money:
Five Years Later (after “increasing medical research funding”)
Clinical trial funding is up 50%! Headlines are written. Backs are patted. A politician poses with a scientist.
Meanwhile, military spending also went up 50%, because central banks printed 50% more money, so the real allocation of brains, factories, and hours is exactly the same. The ratio is still 604 (95% CI: 453-888):1. You gave the medical department a raise and then raised the price of everything they need to buy.
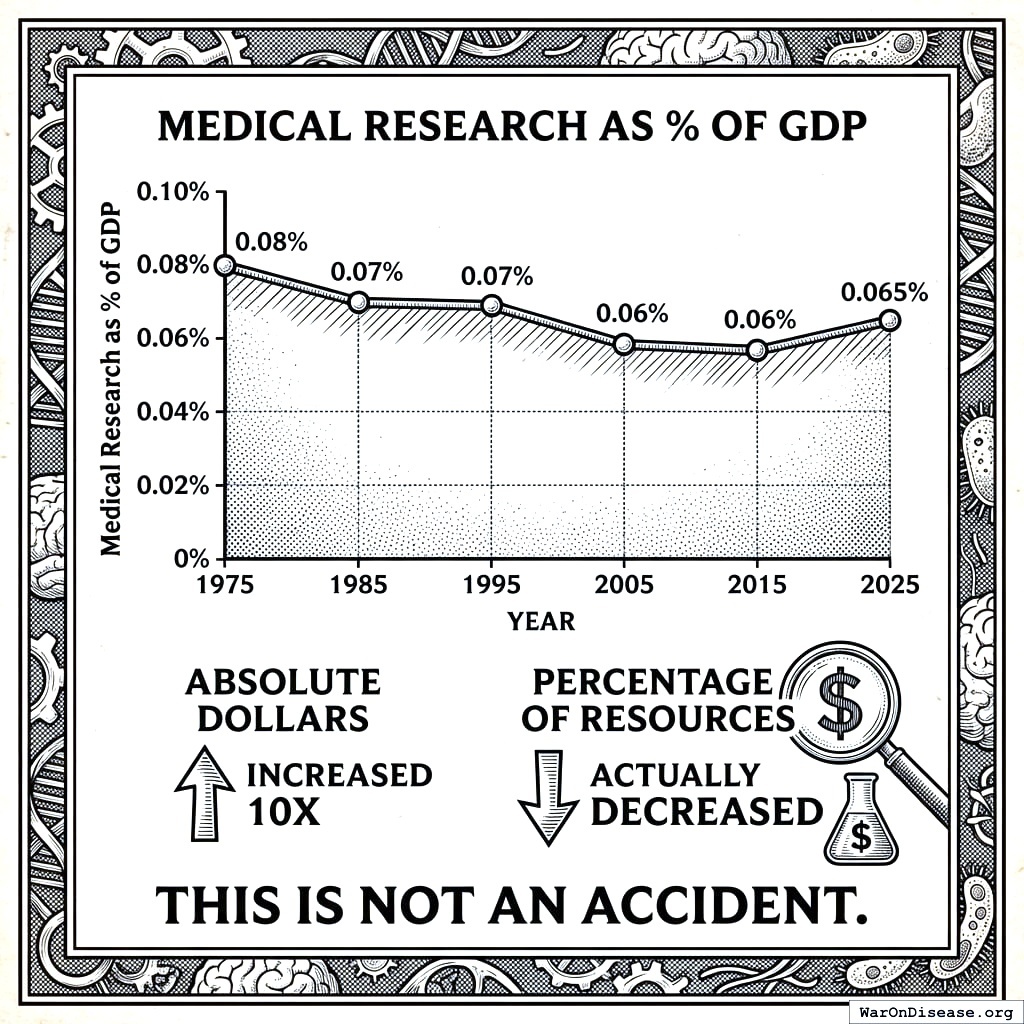
The Proof: 50 Years of Going Nowhere
Medical Research as % of GDP
- 1975: 0.08%
- 1985: 0.07%
- 1995: 0.07%
- 2005: 0.06%
- 2015: 0.06%
- 2025: 0.065%
Absolute dollars increased 10x. Share of actual resources: decreased. You got ten times “richer” and spent a smaller fraction of it on not dying. This is like getting a promotion and canceling your health insurance to celebrate.
What Actually Grew
- Financial sector: 4% to 8% of GDP
- Military-industrial sector: 3% to 3.4% of GDP (the official number; the rest enters your budget wearing other costumes)
- Healthcare spending: 7% to 18% of GDP (most of that growth is billing, not healing)
The part that actually keeps you alive (the actual research into why your cells stop working) is a shrinking fraction of a growing economy. You baked a bigger pie and gave the science department fewer crumbs. Then you named the pie “progress.”
The World’s Most Expensive Abacus
The sector that grew the most deserves special attention, because what it does is very simple and what it costs is very large.
Your financial sector moves money from people who have it to people who need it, and keeps a record of who owes what. That’s it. That is the entire job. An Excel spreadsheet. Remember the eleven-year-old’s science fair project? The network of computers that check each other so nobody can lie? It can replace this entire sector. It runs continuously, employs nobody, and has not made a single error in seventeen years of operation. Your version employs 6.7 million people and captures 8% of your GDP204.
Eight percent of GDP. For an Excel spreadsheet. I checked whether they were using a very complicated spreadsheet. They are not. It has columns and rows. Some of the cells have formulas. This is the same technology a thirteen-year-old uses to track Pokémon stats. It captures 8% of the largest economy in history. The technology to automate it has existed on your planet since 2009. You are paying 6.7 million people to do what the computers are already doing, because the 6.7 million people are very good at making the job sound complicated.
Understanding why your bodies break down requires decoding 3 billion base pairs of DNA, modeling protein folding across millions of configurations, and running clinical trials on thousands of humans for years. Moving money from Account A to Account B requires arithmetic. One of these captures 8% of GDP. The other gets 0.065%. I will let you guess which is which.
That number deserves a second look. Your governments spend $4.5 billion (95% CI: $3 billion-$6 billion) per year testing whether medicines work. The financial sector captures $2.3 trillion per year moving numbers between columns. That $2.3 trillion is 511 years of clinical trials. Five hundred and eleven years. Your entire species could run every government-funded clinical trial on Earth for half a millennium with what you pay the spreadsheet department annually. Every year, you choose the spreadsheet. Every year, the diseases wait.
How the Ledger Ate the Economy
The financial sector didn’t always cost this much. In the early 1970s, it was about 4% of GDP. Finance workers earned roughly the same as everyone else with similar education. A bright graduate from MIT was equally likely to design bridges or trade bonds, because bridges and bonds paid the same205.
Then Nixon cut the dollar from gold, regulations were stripped away, and something interesting happened: by 2006, finance workers earned a 50% premium over equally educated workers in every other sector. Not because the job got harder. (The job is still arithmetic.) Because the money printer printed money, the money went to banks first, and the banks used some of it to hire away every bright person who might otherwise have done something useful.
Philippon and Reshef, two economists who actually measured this, found that 30 to 50% of the finance wage premium is pure rent, meaning excess pay not explained by skill, education, or complexity205. The financial sector pays more not because it’s harder, but because it’s closer to the printer.
Paul Volcker, who ran the Federal Reserve and therefore knew exactly what he was talking about, summarized the result: “We spent several decades not producing many civil engineers and producing a huge number of financial engineers. And the result is shitty bridges and a shitty financial system”206.
A well-run business spends about 1% of revenue on its accounting department. Your economy spends 8%. If a CEO discovered their accounting department was consuming eight times the standard rate and growing, they would fire someone. Your economy gave accounting a raise, a corner office, and the fake Nobel Prize.
“Just Tax the Billionaires”
“Fine,” says the human who just read the last three sections. “The problem is the money goes to the wrong people. Tax the billionaires. Fund medical research. Simple.”
Your species has been trying this for a century. I’ve studied the whole thing. Here is the loop:
Step 1. Tax the wealthy. Victory.
Step 2. The wealthy spend a fraction of those taxes on lobbyists who return $18 for every $1 invested. They secure:
Over $300 billion per year flows back to the people you just taxed, through programs below the human boredom threshold for investigating and too profitable for lobbyists to stop. That is 67 years of clinical trials. Every year. Handed to people who already have money. Every year. While your diseases wait. Every year.
Step 3. The Federal Reserve prints money. Asset prices rise. The billionaires recover what you taxed, and more. The inflation bill goes to the working families you were trying to help. This is called “monetary policy.” You weren’t consulted.
Step 4. Look at the wider wealth gap. Propose: higher taxes on the wealthy.
Return to Step 1. Repeat for 100 years. This recipe is four steps long, which is twice as many as the money-printing recipe. It feels like progress. It is not progress.
The entire planet spends $4.5 billion (95% CI: $3 billion-$6 billion) per year testing whether medicines work in humans60. One country spends over $300 billion per year on corporate handouts to people who already have money. The ratio is roughly 68:1 for subsidizing wealth over curing disease.
Every “tax the billionaires” campaign in history has left this ratio untouched, because the same system that collects the taxes allocates the spending, and that system has a documented 0% correlation with what voters want.
The diagnosis is correct (the allocation is insane). The prescription is the problem: pour more money into a captured system and hope it flows somewhere different this time. The money goes in as taxes. It comes out as subsidies, asset inflation, and an NIH that spends 3.3% (95% CI: 2%-5%) of its budget on clinical trials. The pipe leaks faster than you can fill it, and the leaks flow upward.
This is why the 1% Treaty207 208 doesn’t route funding through your existing institutions. It builds a new pipe that the lobbyists haven’t found yet.
You don’t fix a rigged game by playing harder. You build a different game.
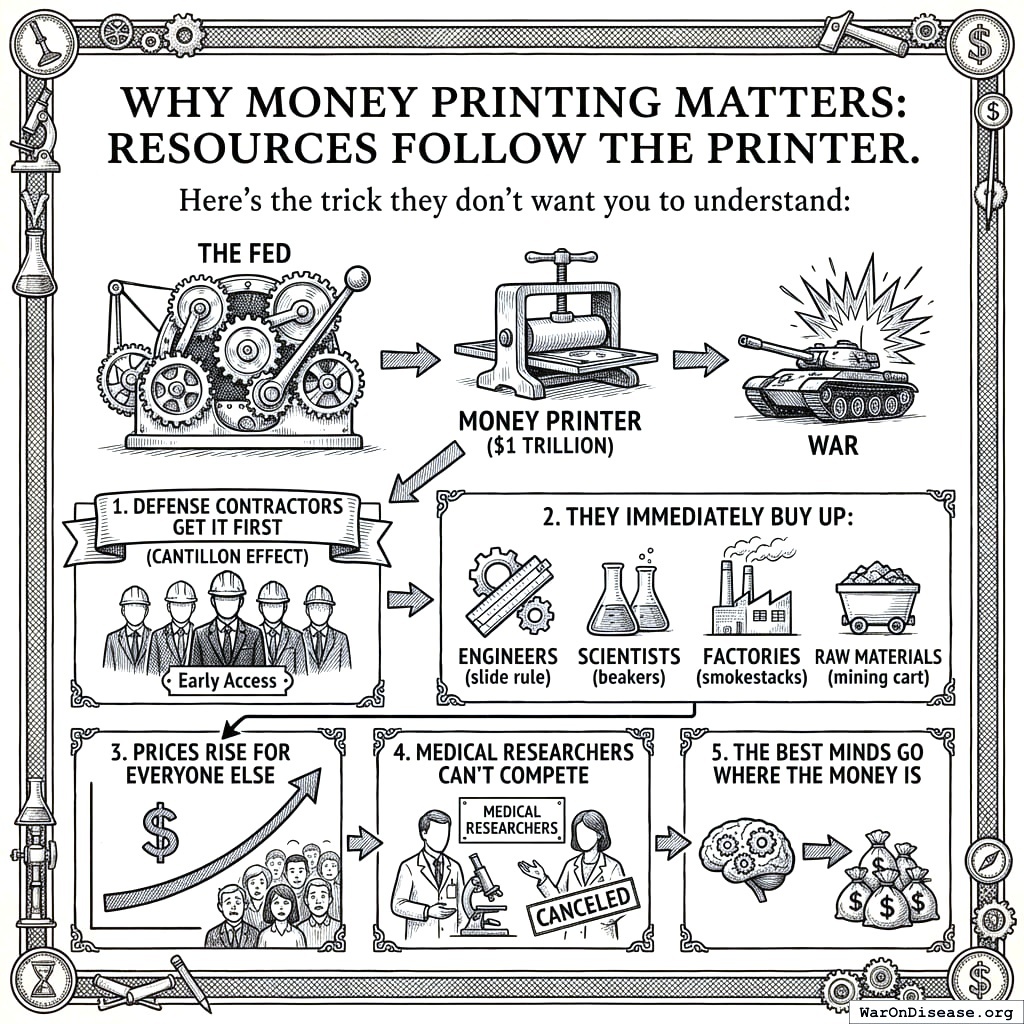
Why Money Printing Matters: Geniuses Follow the Money
When the Fed prints a trillion dollars for war, weapons manufacturers get it first and immediately buy the best engineers, scientists, and equipment.
An MIT graduate with $200,000 in student debt chooses between:
- Raytheon: $150,000/year, full benefits, signing bonus (makes missiles)
- NIH postdoc: $55,000/year, shared office, vending machine (cures diseases)
Student debt does not negotiate. The graduate goes to Raytheon. She is now very good at making things that find other things and then both things stop existing. She could have been very good at making your cells stop forgetting how to cell. But Raytheon offered dental. The NIH offered a lanyard.
Multiply this decision by every talented graduate, every year, for fifty years. Then wonder why nobody cured your mother’s cancer. Then blame the graduate.
Printing more money for medicine doesn’t fix this, because the money printer prints even more for war, and the ratio stays the same. The hamster runs faster. The wheel doesn’t move.
The only fix is to change the ratio. Take from the war budget. Give to the life budget. That’s what the 1% Treaty does. Not because it’s moral (though it is). Because it’s the only thing that moves the geniuses. You cannot out-inspire a signing bonus. You can only outbid it.
The Two Receipts
I promised I’d come back to the eleven-year-old’s science fair project. Here it is.
This chapter has two receipts. I want to put them next to each other, because your species prefers to look at them one at a time, the way a doctor might prefer to review a patient’s symptoms one at a time if the doctor were also the disease.
Receipt 1: What the Printer Helped Kill
310 million deaths (95% CI: 200 million deaths-340 million deaths) since 1900. Over $16 trillion spent on the six-war receipt above alone. Every war that killed more than a million people required printing money. The list under hard money is empty.
Every war on this list required a room where a small number of humans could create money without being checked. The eleven-year-old’s science fair project is a room where every computer checks every other computer. You cannot secretly print money on it. You cannot fund a war nobody voted for, because the computers say “no you didn’t” and ignore you.
Remove the room and you remove the wars. 310 million deaths (95% CI: 200 million deaths-340 million deaths). That is the price of a room without a check.
Receipt 2: What the Printer Wasted
Your governments spend $4.5 billion (95% CI: $3 billion-$6 billion) per year testing whether medicines work. Here is what the printer spent instead, measured in years of that:
The six wars on this receipt cost over $16 trillion (US share only). That is 3,500 years of clinical trials. But those are just the named wars. Cumulative global military spending since the Fed was created exceeds $170 trillion. Nearly 38,000 years of clinical trials. Spent on killing.
And that is just the killing. The printer also built itself a bureaucracy:
- The financial sector captures $2.3 trillion per year (8% of GDP) to move money and keep a ledger204. That is 511 years of clinical trials. Every year. For arithmetic. The eleven-year-old’s science fair project does this for free. It has done it for free since 2009. You are paying 6.7 million people to do what the computers are already doing, and you have been doing it for seventeen years since the computers made it pointless.
- The Fed printed $4 trillion in 2020 for banks: 889 years192
- The 2008 bailout: $700 billion for banks: 156 years196
- Corporate welfare: $300 billion per year for having lobbyists: 67 years, annually
The printer funded the wars. The printer inflated the financial sector. The printer bailed out the banks. The eleven-year-old’s invention makes all of it unnecessary: no room, no unchecked printing, no 8% GDP spreadsheet department, no wars funded without consent. The technology has existed since 2009. Your species is using it to trade pictures of dogs in hats.
A Modest Proposal
I want you to think about someone you’ve lost. A parent. A friend. A child. Think about the disease that killed them. Now understand: the money to fund the clinical trial that might have saved them was created on a Tuesday afternoon, by a committee you’ve never heard of, and handed to a build bombs or conduct wars you would not donate your money to. The bank did not cure your mother. Your mother is still dead. The spreadsheet is doing fine.
The 1% Treaty redirects 1% of the global military budget. $27.2 billion per year.
Your species has 7,000 diseases with zero approved treatments. At current capacity, testing them takes 443 years. At treaty funding, it takes 36 years (95% CI: 8.15 years-106 years). One generation instead of five centuries.
The printer spent nearly 38,000 years of clinical trials on killing.
I have been watching your species for 80 years and I still cannot tell whether you are bad at math or just very, very well trained.
1.
NIH Common Fund. NIH pragmatic trials: Minimal funding despite 30x cost advantage.
NIH Common Fund: HCS Research Collaboratory https://commonfund.nih.gov/hcscollaboratory (2025)
The NIH Pragmatic Trials Collaboratory funds trials at $500K for planning phase, $1M/year for implementation-a tiny fraction of NIH’s budget. The ADAPTABLE trial cost $14 million for 15,076 patients (= $929/patient) versus $420 million for a similar traditional RCT (30x cheaper), yet pragmatic trials remain severely underfunded. PCORnet infrastructure enables real-world trials embedded in healthcare systems, but receives minimal support compared to basic research funding. Additional sources: https://commonfund.nih.gov/hcscollaboratory | https://pcornet.org/wp-content/uploads/2025/08/ADAPTABLE_Lay_Summary_21JUL2025.pdf | https://www.ncbi.nlm.nih.gov/pmc/articles/PMC5604499/
.
2.
Cato Institute. Chance of dying from terrorism statistic.
Cato Institute: Terrorism and Immigration Risk Analysis https://www.cato.org/policy-analysis/terrorism-immigration-risk-analysis Chance of American dying in foreign-born terrorist attack: 1 in 3.6 million per year (1975-2015) Including 9/11 deaths; annual murder rate is 253x higher than terrorism death rate More likely to die from lightning strike than foreign terrorism Note: Comprehensive 41-year study shows terrorism risk is extremely low compared to everyday dangers Additional sources: https://www.cato.org/policy-analysis/terrorism-immigration-risk-analysis | https://www.nbcnews.com/news/us-news/you-re-more-likely-die-choking-be-killed-foreign-terrorists-n715141
.
3.
NIH. Antidepressant clinical trial exclusion rates.
Zimmerman et al. https://pubmed.ncbi.nlm.nih.gov/26276679/ (2015)
Mean exclusion rate: 86.1% across 158 antidepressant efficacy trials (range: 44.4% to 99.8%) More than 82% of real-world depression patients would be ineligible for antidepressant registration trials Exclusion rates increased over time: 91.4% (2010-2014) vs. 83.8% (1995-2009) Most common exclusions: comorbid psychiatric disorders, age restrictions, insufficient depression severity, medical conditions Emergency psychiatry patients: only 3.3% eligible (96.7% excluded) when applying 9 common exclusion criteria Only a minority of depressed patients seen in clinical practice are likely to be eligible for most AETs Note: Generalizability of antidepressant trials has decreased over time, with increasingly stringent exclusion criteria eliminating patients who would actually use the drugs in clinical practice Additional sources: https://pubmed.ncbi.nlm.nih.gov/26276679/ | https://pubmed.ncbi.nlm.nih.gov/26164052/ | https://www.wolterskluwer.com/en/news/antidepressant-trials-exclude-most-real-world-patients-with-depression
.
4.
CNBC. Warren buffett’s career average investment return.
CNBC https://www.cnbc.com/2025/05/05/warren-buffetts-return-tally-after-60-years-5502284percent.html (2025)
Berkshire’s compounded annual return from 1965 through 2024 was 19.9%, nearly double the 10.4% recorded by the S&P 500. Berkshire shares skyrocketed 5,502,284% compared to the S&P 500’s 39,054% rise during that period. Additional sources: https://www.cnbc.com/2025/05/05/warren-buffetts-return-tally-after-60-years-5502284percent.html | https://www.slickcharts.com/berkshire-hathaway/returns
.
5.
World Health Organization. WHO global health estimates 2024.
World Health Organization https://www.who.int/data/gho/data/themes/mortality-and-global-health-estimates (2024)
Comprehensive mortality and morbidity data by cause, age, sex, country, and year Global mortality: 55-60 million deaths annually Lives saved by modern medicine (vaccines, cardiovascular drugs, oncology): 12M annually (conservative aggregate) Leading causes of death: Cardiovascular disease (17.9M), Cancer (10.3M), Respiratory disease (4.0M) Note: Baseline data for regulatory mortality analysis. Conservative estimate of pharmaceutical impact based on WHO immunization data (4.5M/year from vaccines) + cardiovascular interventions (3.3M/year) + oncology (1.5M/year) + other therapies. Additional sources: https://www.who.int/data/gho/data/themes/mortality-and-global-health-estimates
.
6.
GiveWell. GiveWell cost per life saved for top charities (2024).
GiveWell: Top Charities https://www.givewell.org/charities/top-charities General range: $3,000-$5,500 per life saved (GiveWell top charities) Helen Keller International (Vitamin A): $3,500 average (2022-2024); varies $1,000-$8,500 by country Against Malaria Foundation: $5,500 per life saved New Incentives (vaccination incentives): $4,500 per life saved Malaria Consortium (seasonal malaria chemoprevention): $3,500 per life saved VAS program details: $2 to provide vitamin A supplements to child for one year Note: Figures accurate for 2024. Helen Keller VAS program has wide country variation ($1K-$8.5K) but $3,500 is accurate average. Among most cost-effective interventions globally Additional sources: https://www.givewell.org/charities/top-charities | https://www.givewell.org/charities/helen-keller-international | https://ourworldindata.org/cost-effectiveness
.
7.
U.S. Department of Defense.
5.56mm NATO ammunition bulk procurement pricing. (2024)
The cost of 5.56mm NATO ammunition at military bulk procurement rates is approximately $0.40 per round, based on Lake City Army Ammunition Plant production and commercial market floor prices for mil-spec M855 ammunition.
8.
Pike, J.
U.s. Forces fire 250,000 rounds for every insurgent killed. (2011)
The General Accounting Office reports that US forces used 1.8 billion rounds of small-arms ammunition per year, a level that more than doubled in five years. An estimated 250,000 rounds were fired for every insurgent killed in Iraq and Afghanistan.
9.
AARP. Unpaid caregiver hours and economic value.
AARP 2023 https://www.aarp.org/caregiving/financial-legal/info-2023/unpaid-caregivers-provide-billions-in-care.html (2023)
Average family caregiver: 25-26 hours per week (100-104 hours per month) 38 million caregivers providing 36 billion hours of care annually Economic value: $16.59 per hour = $600 billion total annual value (2021) 28% of people provided eldercare on a given day, averaging 3.9 hours when providing care Caregivers living with care recipient: 37.4 hours per week Caregivers not living with recipient: 23.7 hours per week Note: Disease-related caregiving is subset of total; includes elderly care, disability care, and child care Additional sources: https://www.aarp.org/caregiving/financial-legal/info-2023/unpaid-caregivers-provide-billions-in-care.html | https://www.bls.gov/news.release/elcare.nr0.htm | https://www.caregiver.org/resource/caregiver-statistics-demographics/
.
11.
Forbes.
Forbes world’s billionaires list 2024. (2024)
Forbes identified a record 2,781 billionaires worldwide with combined net worth of $14.2 trillion, 141 more than 2023. Bernard Arnault (LVMH) topped the list at $233 billion.
12.
CDC MMWR. Childhood vaccination economic benefits.
CDC MMWR https://www.cdc.gov/mmwr/volumes/73/wr/mm7331a2.htm (1994)
US programs (1994-2023): $540B direct savings, $2.7T societal savings ( $18B/year direct, $90B/year societal) Global (2001-2020): $820B value for 10 diseases in 73 countries ( $41B/year) ROI: $11 return per $1 invested Measles vaccination alone saved 93.7M lives (61% of 154M total) over 50 years (1974-2024) Additional sources: https://www.cdc.gov/mmwr/volumes/73/wr/mm7331a2.htm | https://www.thelancet.com/journals/lancet/article/PIIS0140-6736(24)00850-X/fulltext
.
16.
U.S. Bureau of Labor Statistics.
CPI inflation calculator. (2024)
CPI-U (1980): 82.4 CPI-U (2024): 313.5 Inflation multiplier (1980-2024): 3.80× Cumulative inflation: 280.48% Average annual inflation rate: 3.08% Note: Official U.S. government inflation data using Consumer Price Index for All Urban Consumers (CPI-U). Additional sources: https://www.bls.gov/data/inflation_calculator.htm
.
17.
James Surowiecki.
The Wisdom of Crowds. (Surowiecki, 2004).
Explores the aggregation of information in groups, arguing that decisions are often better than could have been made by any single member of the group. The opening anecdote relates Francis Galton’s surprise that the crowd at a county fair accurately guessed the weight of an ox when the median of their individual guesses was taken. The three conditions for a group to be intelligent are diversity, independence, and decentralization. Additional sources: https://archive.org/details/wisdomofcrowds0000suro | https://en.wikipedia.org/wiki/The_Wisdom_of_Crowds | https://www.amazon.com/Wisdom-Crowds-James-Surowiecki/dp/0385721706
.
18.
ClinicalTrials.gov API v2 direct analysis. ClinicalTrials.gov cumulative enrollment data (2025).
Direct analysis via ClinicalTrials.gov API v2 https://clinicaltrials.gov/data-api/api Analysis of 100,000 active/recruiting/completed trials on ClinicalTrials.gov (as of January 2025) shows cumulative enrollment of 12.2 million participants: Phase 1 (722k), Phase 2 (2.2M), Phase 3 (6.5M), Phase 4 (2.7M). Median participants per trial: Phase 1 (33), Phase 2 (60), Phase 3 (237), Phase 4 (90). Additional sources: https://clinicaltrials.gov/data-api/api
.
19.
ACS CAN. Clinical trial patient participation rate.
ACS CAN: Barriers to Clinical Trial Enrollment https://www.fightcancer.org/policy-resources/barriers-patient-enrollment-therapeutic-clinical-trials-cancer Only 3-5% of adult cancer patients in US receive treatment within clinical trials About 5% of American adults have ever participated in any clinical trial Oncology: 2-3% of all oncology patients participate Contrast: 50-60% enrollment for pediatric cancer trials (<15 years old) Note: 20% of cancer trials fail due to insufficient enrollment; 11% of research sites enroll zero patients Additional sources: https://www.fightcancer.org/policy-resources/barriers-patient-enrollment-therapeutic-clinical-trials-cancer | https://hints.cancer.gov/docs/Briefs/HINTS_Brief_48.pdf
.
20.
ScienceDaily. Global prevalence of chronic disease.
ScienceDaily: GBD 2015 Study https://www.sciencedaily.com/releases/2015/06/150608081753.htm (2015)
2.3 billion individuals had more than five ailments (2013) Chronic conditions caused 74% of all deaths worldwide (2019), up from 67% (2010) Approximately 1 in 3 adults suffer from multiple chronic conditions (MCCs) Risk factor exposures: 2B exposed to biomass fuel, 1B to air pollution, 1B smokers Projected economic cost: $47 trillion by 2030 Note: 2.3B with 5+ ailments is more accurate than "2B with chronic disease." One-third of all adults globally have multiple chronic conditions Additional sources: https://www.sciencedaily.com/releases/2015/06/150608081753.htm | https://pmc.ncbi.nlm.nih.gov/articles/PMC10830426/ | https://pmc.ncbi.nlm.nih.gov/articles/PMC6214883/
.
21.
C&EN. Annual number of new drugs approved globally: 50.
C&EN https://cen.acs.org/pharmaceuticals/50-new-drugs-received-FDA/103/i2 (2025)
50 new drugs approved annually Additional sources: https://cen.acs.org/pharmaceuticals/50-new-drugs-received-FDA/103/i2 | https://www.fda.gov/drugs/development-approval-process-drugs/novel-drug-approvals-fda
.
22.
Williams, R. J., Tse, T., DiPiazza, K. & Zarin, D. A.
Terminated trials in the ClinicalTrials.gov results database: Evaluation of availability of primary outcome data and reasons for termination.
PLOS One 10, e0127242 (2015)
Approximately 12% of trials with results posted on the ClinicalTrials.gov results database (905/7,646) were terminated. Primary reasons: insufficient accrual (57% of non-data-driven terminations), business/strategic reasons, and efficacy/toxicity findings (21% data-driven terminations).
25.
OpenSecrets. Defense sector lobbying summary.
OpenSecrets https://www.opensecrets.org/federal-lobbying/sectors/summary?id=D (2025)
Military sector federal lobbying totaled $198,009,793 in 2025, up from $159.5 million in 2024 and $142.9 million in 2023. Additional sources: https://www.opensecrets.org/federal-lobbying/sectors/summary?id=D
.
26.
Companies Market Cap.
BAE systems and thales market capitalization. (2026)
BAE Systems market capitalization approx $75.80B and Thales approx $56.68B as of June 2026, combined approx $132.5B for the two major allied European military primes. Additional sources: https://companiesmarketcap.com/thales/marketcap/
.
27.
Stock Analysis.
Military prime contractor market capitalization and float statistics. (2026)
Combined market capitalization of 11 US military primes approx $835.8B at the 2026-06-11 close: RTX $248.07B, Boeing $174.71B, Lockheed Martin $126.51B, General Dynamics $96.90B, Northrop Grumman $78.48B, L3Harris $58.16B, Leidos $15.36B, Huntington Ingalls $11.86B, CACI $11.61B, Booz Allen Hamilton $9.24B, SAIC $4.86B. Tradeable float across the 13 Western primes (adding BAE Systems and Thales) approx $880B, about 91 percent of combined cap (range $850-900B), from per-company float and shares-outstanding statistics pages; big-5 floats verified individually (RTX 92.6%, BA 96.0%, LMT 85.7%, GD 94.2%, NOC 99.7%); Thales is the outlier at approx 45% float because the French State (26.60%) and Dassault Aviation (26.59%) stakes are locked. Additional sources: https://stockanalysis.com/stocks/rtx/statistics/ | https://www.dassault-aviation.com/en/group/about-us/shareholding-structure-and-organization-chart/
.
28.
Rummel, R. J.
Death by Government: Genocide and Mass Murder Since 1900. (Transaction Publishers, 1994).
Political scientist R.J. Rummel’s comprehensive accounting of democide (government murder of unarmed civilians) in the 20th century. His final revised estimate: 262 million people murdered by their own governments from 1900-1999, excluding battle deaths in wars. Range: 200-272+ million. Communist regimes account for the largest share (100-148+ million). Updated figures at hawaii.edu/powerkills.
29.
GiveWell. Cost per DALY for deworming programs.
https://www.givewell.org/international/technical/programs/deworming/cost-effectiveness Schistosomiasis treatment: $28.19-$70.48 per DALY (using arithmetic means with varying disability weights) Soil-transmitted helminths (STH) treatment: $82.54 per DALY (midpoint estimate) Note: GiveWell explicitly states this 2011 analysis is "out of date" and their current methodology focuses on long-term income effects rather than short-term health DALYs Additional sources: https://www.givewell.org/international/technical/programs/deworming/cost-effectiveness
.
30.
Calculated from IHME Global Burden of Disease (2.55B DALYs) and global GDP per capita valuation. $109 trillion annual global disease burden.
The global economic burden of disease, including direct healthcare costs ($8.2 trillion) and lost productivity ($100.9 trillion from 2.55 billion DALYs × $39,570 per DALY), totals approximately $109.1 trillion annually.
32.
Think by Numbers. Pre-1962 drug development costs and timeline (think by numbers).
Think by Numbers: How Many Lives Does FDA Save? https://thinkbynumbers.org/health/how-many-net-lives-does-the-fda-save/ (1962)
Historical estimates (1970-1985): USD $226M fully capitalized (2011 prices) 1980s drugs: $65M after-tax R&D (1990 dollars), $194M compounded to approval (1990 dollars) Modern comparison: $2-3B costs, 7-12 years (dramatic increase from pre-1962) Context: 1962 regulatory clampdown reduced new treatment production by 70%, dramatically increasing development timelines and costs Note: Secondary source; less reliable than Congressional testimony Additional sources: https://thinkbynumbers.org/health/how-many-net-lives-does-the-fda-save/ | https://en.wikipedia.org/wiki/Cost_of_drug_development | https://www.statnews.com/2018/10/01/changing-1962-law-slash-drug-prices/
.
33.
Biotechnology Innovation Organization (BIO). BIO clinical development success rates 2011-2020.
Biotechnology Innovation Organization (BIO) https://go.bio.org/rs/490-EHZ-999/images/ClinicalDevelopmentSuccessRates2011_2020.pdf (2021)
Phase I duration: 2.3 years average Total time to market (Phase I-III + approval): 10.5 years average Phase transition success rates: Phase I→II: 63.2%, Phase II→III: 30.7%, Phase III→Approval: 58.1% Overall probability of approval from Phase I: 12% Note: Largest publicly available study of clinical trial success rates. Efficacy lag = 10.5 - 2.3 = 8.2 years post-safety verification. Additional sources: https://go.bio.org/rs/490-EHZ-999/images/ClinicalDevelopmentSuccessRates2011_2020.pdf
.
34.
Nature Medicine. Drug repurposing rate ( 30%).
Nature Medicine https://www.nature.com/articles/s41591-024-03233-x (2024)
Approximately 30% of drugs gain at least one new indication after initial approval. Additional sources: https://www.nature.com/articles/s41591-024-03233-x
.
35.
EPI. Education investment economic multiplier (2.1).
EPI: Public Investments Outside Core Infrastructure https://www.epi.org/publication/bp348-public-investments-outside-core-infrastructure/ Early childhood education: Benefits 12X outlays by 2050; $8.70 per dollar over lifetime Educational facilities: $1 spent → $1.50 economic returns Energy efficiency comparison: 2-to-1 benefit-to-cost ratio (McKinsey) Private return to schooling: 9% per additional year (World Bank meta-analysis) Note: 2.1 multiplier aligns with benefit-to-cost ratios for educational infrastructure/energy efficiency. Early childhood education shows much higher returns (12X by 2050) Additional sources: https://www.epi.org/publication/bp348-public-investments-outside-core-infrastructure/ | https://documents1.worldbank.org/curated/en/442521523465644318/pdf/WPS8402.pdf | https://freopp.org/whitepapers/establishing-a-practical-return-on-investment-framework-for-education-and-skills-development-to-expand-economic-opportunity/
.
36.
PMC. Healthcare investment economic multiplier (1.8).
PMC: California Universal Health Care https://pmc.ncbi.nlm.nih.gov/articles/PMC5954824/ (2022)
Healthcare fiscal multiplier: 4.3 (95% CI: 2.5-6.1) during pre-recession period (1995-2007) Overall government spending multiplier: 1.61 (95% CI: 1.37-1.86) Why healthcare has high multipliers: No effect on trade deficits (spending stays domestic); improves productivity & competitiveness; enhances long-run potential output Gender-sensitive fiscal spending (health & care economy) produces substantial positive growth impacts Note: "1.8" appears to be conservative estimate; research shows healthcare multipliers of 4.3 Additional sources: https://pmc.ncbi.nlm.nih.gov/articles/PMC5954824/ | https://cepr.org/voxeu/columns/government-investment-and-fiscal-stimulus | https://ncbi.nlm.nih.gov/pmc/articles/PMC3849102/ | https://set.odi.org/wp-content/uploads/2022/01/Fiscal-multipliers-review.pdf
.
37.
World Bank. Infrastructure investment economic multiplier (1.6).
World Bank: Infrastructure Investment as Stimulus https://blogs.worldbank.org/en/ppps/effectiveness-infrastructure-investment-fiscal-stimulus-what-weve-learned (2022)
Infrastructure fiscal multiplier: 1.6 during contractionary phase of economic cycle Average across all economic states: 1.5 (meaning $1 of public investment → $1.50 of economic activity) Time horizon: 0.8 within 1 year, 1.5 within 2-5 years Range of estimates: 1.5-2.0 (following 2008 financial crisis & American Recovery Act) Italian public construction: 1.5-1.9 multiplier US ARRA: 0.4-2.2 range (differential impacts by program type) Economic Policy Institute: Uses 1.6 for infrastructure spending (middle range of estimates) Note: Public investment less likely to crowd out private activity during recessions; particularly effective when monetary policy loose with near-zero rates Additional sources: https://blogs.worldbank.org/en/ppps/effectiveness-infrastructure-investment-fiscal-stimulus-what-weve-learned | https://www.gihub.org/infrastructure-monitor/insights/fiscal-multiplier-effect-of-infrastructure-investment/ | https://cepr.org/voxeu/columns/government-investment-and-fiscal-stimulus | https://www.richmondfed.org/publications/research/economic_brief/2022/eb_22-04
.
38.
Mercatus. Military spending economic multiplier (0.6).
Mercatus: Defense Spending and Economy https://www.mercatus.org/research/research-papers/defense-spending-and-economy Ramey (2011): 0.6 short-run multiplier Barro (1981): 0.6 multiplier for WWII spending (war spending crowded out 40¢ private economic activity per federal dollar) Barro & Redlick (2011): 0.4 within current year, 0.6 over two years; increased govt spending reduces private-sector GDP portions General finding: $1 increase in deficit-financed federal military spending = less than $1 increase in GDP Variation by context: Central/Eastern European NATO: 0.6 on impact, 1.5-1.6 in years 2-3, gradual fall to zero Ramey & Zubairy (2018): Cumulative 1% GDP increase in military expenditure raises GDP by 0.7% Additional sources: https://www.mercatus.org/research/research-papers/defense-spending-and-economy | https://cepr.org/voxeu/columns/world-war-ii-america-spending-deficits-multipliers-and-sacrifice | https://www.rand.org/content/dam/rand/pubs/research_reports/RRA700/RRA739-2/RAND_RRA739-2.pdf
.
40.
FDA. FDA-approved prescription drug products (20,000+).
FDA https://www.fda.gov/media/143704/download There are over 20,000 prescription drug products approved for marketing. Additional sources: https://www.fda.gov/media/143704/download
.
43.
ACLED. Active combat deaths annually.
ACLED: Global Conflict Surged 2024 https://acleddata.com/2024/12/12/data-shows-global-conflict-surged-in-2024-the-washington-post/ (2024)
2024: 233,597 deaths (30% increase from 179,099 in 2023) Deadliest conflicts: Ukraine (67,000), Palestine (35,000) Nearly 200,000 acts of violence (25% higher than 2023, double from 5 years ago) One in six people globally live in conflict-affected areas Additional sources: https://acleddata.com/2024/12/12/data-shows-global-conflict-surged-in-2024-the-washington-post/ | https://acleddata.com/media-citation/data-shows-global-conflict-surged-2024-washington-post | https://acleddata.com/conflict-index/index-january-2024/
.
44.
UCDP. State violence deaths annually.
UCDP: Uppsala Conflict Data Program https://ucdp.uu.se/ Uppsala Conflict Data Program (UCDP): Tracks one-sided violence (organized actors attacking unarmed civilians) UCDP definition: Conflicts causing at least 25 battle-related deaths in calendar year 2023 total organized violence: 154,000 deaths; Non-state conflicts: 20,900 deaths UCDP collects data on state-based conflicts, non-state conflicts, and one-sided violence Specific "2,700 annually" figure for state violence not found in recent UCDP data; actual figures vary annually Additional sources: https://ucdp.uu.se/ | https://en.wikipedia.org/wiki/Uppsala_Conflict_Data_Program | https://ourworldindata.org/grapher/deaths-in-armed-conflicts-by-region
.
45.
Our World in Data. Terror attack deaths (8,300 annually).
Our World in Data: Terrorism https://ourworldindata.org/terrorism (2024)
2023: 8,352 deaths (22% increase from 2022, highest since 2017) 2023: 3,350 terrorist incidents (22% decrease), but 56% increase in avg deaths per attack Global Terrorism Database (GTD): 200,000+ terrorist attacks recorded (2021 version) Maintained by: National Consortium for Study of Terrorism & Responses to Terrorism (START), U. of Maryland Geographic shift: Epicenter moved from Middle East to Central Sahel (sub-Saharan Africa) - now >50% of all deaths Additional sources: https://ourworldindata.org/terrorism | https://reliefweb.int/report/world/global-terrorism-index-2024 | https://www.start.umd.edu/gtd/ | https://ourworldindata.org/grapher/fatalities-from-terrorism
.
46.
Institute for Health Metrics and Evaluation (IHME). IHME global burden of disease 2021 (2.88B DALYs, 1.13B YLD).
Institute for Health Metrics and Evaluation (IHME) https://vizhub.healthdata.org/gbd-results/ (2024)
In 2021, global DALYs totaled approximately 2.88 billion, comprising 1.75 billion Years of Life Lost (YLL) and 1.13 billion Years Lived with Disability (YLD). This represents a 13% increase from 2019 (2.55B DALYs), largely attributable to COVID-19 deaths and aging populations. YLD accounts for approximately 39% of total DALYs, reflecting the substantial burden of non-fatal chronic conditions. Additional sources: https://vizhub.healthdata.org/gbd-results/ | https://www.thelancet.com/journals/lancet/article/PIIS0140-6736(24)00757-8/fulltext | https://www.healthdata.org/research-analysis/about-gbd
.
47.
Costs of War Project, Brown University Watson Institute. Environmental cost of war ($100B annually).
Brown Watson Costs of War: Environmental Cost https://watson.brown.edu/costsofwar/costs/social/environment War on Terror emissions: 1.2B metric tons GHG (equivalent to 257M cars/year) Military: 5.5% of global GHG emissions (2X aviation + shipping combined) US DoD: World’s single largest institutional oil consumer, 47th largest emitter if nation Cleanup costs: $500B+ for military contaminated sites Gaza war environmental damage: $56.4B; landmine clearance: $34.6B expected Climate finance gap: Rich nations spend 30X more on military than climate finance Note: Military activities cause massive environmental damage through GHG emissions, toxic contamination, and long-term cleanup costs far exceeding current climate finance commitments Additional sources: https://watson.brown.edu/costsofwar/costs/social/environment | https://earth.org/environmental-costs-of-wars/ | https://transformdefence.org/transformdefence/stats/
.
48.
ScienceDaily. Medical research lives saved annually (4.2 million).
ScienceDaily: Physical Activity Prevents 4M Deaths https://www.sciencedaily.com/releases/2020/06/200617194510.htm (2020)
Physical activity: 3.9M early deaths averted annually worldwide (15% lower premature deaths than without) COVID vaccines (2020-2024): 2.533M deaths averted, 14.8M life-years preserved; first year alone: 14.4M deaths prevented Cardiovascular prevention: 3 interventions could delay 94.3M deaths over 25 years (antihypertensives alone: 39.4M) Pandemic research response: Millions of deaths averted through rapid vaccine/drug development Additional sources: https://www.sciencedaily.com/releases/2020/06/200617194510.htm | https://pmc.ncbi.nlm.nih.gov/articles/PMC9537923/ | https://www.ahajournals.org/doi/10.1161/CIRCULATIONAHA.118.038160 | https://pmc.ncbi.nlm.nih.gov/articles/PMC9464102/
.
49.
SIPRI. 36:1 disparity ratio of spending on weapons over cures.
SIPRI: Military Spending https://www.sipri.org/commentary/blog/2016/opportunity-cost-world-military-spending (2016)
Global military spending: $2.7 trillion (2024, SIPRI) Global government medical research: $68 billion (2024) Actual ratio: 39.7:1 in favor of weapons over medical research Military R&D alone: $85B (2004 data, 10% of global R&D) Military spending increases crowd out health: 1% ↑ military = 0.62% ↓ health spending Note: Ratio actually worse than 36:1. Each 1% increase in military spending reduces health spending by 0.62%, with effect more intense in poorer countries (0.962% reduction) Additional sources: https://www.sipri.org/commentary/blog/2016/opportunity-cost-world-military-spending | https://pmc.ncbi.nlm.nih.gov/articles/PMC9174441/ | https://www.congress.gov/crs-product/R45403
.
50.
Think by Numbers. Lost human capital due to war ($270B annually).
Think by Numbers https://thinkbynumbers.org/military/war/the-economic-case-for-peace-a-comprehensive-financial-analysis/ (2021)
Lost human capital from war: $300B annually (economic impact of losing skilled/productive individuals to conflict) Broader conflict/violence cost: $14T/year globally 1.4M violent deaths/year; conflict holds back economic development, causes instability, widens inequality, erodes human capital 2002: 48.4M DALYs lost from 1.6M violence deaths = $151B economic value (2000 USD) Economic toll includes: commodity prices, inflation, supply chain disruption, declining output, lost human capital Additional sources: https://thinkbynumbers.org/military/war/the-economic-case-for-peace-a-comprehensive-financial-analysis/ | https://www.weforum.org/stories/2021/02/war-violence-costs-each-human-5-a-day/ | https://pubmed.ncbi.nlm.nih.gov/19115548/
.
51.
PubMed. Psychological impact of war cost ($100B annually).
PubMed: Economic Burden of PTSD https://pubmed.ncbi.nlm.nih.gov/35485933/ PTSD economic burden (2018 U.S.): $232.2B total ($189.5B civilian, $42.7B military) Civilian costs driven by: Direct healthcare ($66B), unemployment ($42.7B) Military costs driven by: Disability ($17.8B), direct healthcare ($10.1B) Exceeds costs of other mental health conditions (anxiety, depression) War-exposed populations: 2-3X higher rates of anxiety, depression, PTSD; women and children most vulnerable Note: Actual burden $232B, significantly higher than "$100B" claimed Additional sources: https://pubmed.ncbi.nlm.nih.gov/35485933/ | https://news.va.gov/103611/study-national-economic-burden-of-ptsd-staggering/ | https://pmc.ncbi.nlm.nih.gov/articles/PMC9957523/
.
52.
CGDev. UNHCR average refugee support cost.
CGDev https://www.cgdev.org/blog/costs-hosting-refugees-oecd-countries-and-why-uk-outlier (2024)
The average cost of supporting a refugee is $1,384 per year. This represents total host country costs (housing, healthcare, education, security). OECD countries average $6,100 per refugee (mean 2022-2023), with developing countries spending $700-1,000. Global weighted average of $1,384 is reasonable given that 75-85% of refugees are in low/middle-income countries. Additional sources: https://www.cgdev.org/blog/costs-hosting-refugees-oecd-countries-and-why-uk-outlier | https://www.unhcr.org/sites/default/files/2024-11/UNHCR-WB-global-cost-of-refugee-inclusion-in-host-country-health-systems.pdf
.
53.
World Bank. World bank trade disruption cost from conflict.
World Bank https://www.worldbank.org/en/topic/trade/publication/trading-away-from-conflict Estimated $616B annual cost from conflict-related trade disruption. World Bank research shows civil war costs an average developing country 30 years of GDP growth, with 20 years needed for trade to return to pre-war levels. Trade disputes analysis shows tariff escalation could reduce global exports by up to $674 billion. Additional sources: https://www.worldbank.org/en/topic/trade/publication/trading-away-from-conflict | https://www.nber.org/papers/w11565 | http://blogs.worldbank.org/en/trade/impacts-global-trade-and-income-current-trade-disputes
.
54.
VA. Veteran healthcare cost projections.
VA https://department.va.gov/wp-content/uploads/2025/06/2026-Budget-in-Brief.pdf (2026)
VA budget: $441.3B requested for FY 2026 (10% increase). Disability compensation: $165.6B in FY 2024 for 6.7M veterans. PACT Act projected to increase spending by $300B between 2022-2031. Costs under Toxic Exposures Fund: $20B (2024), $30.4B (2025), $52.6B (2026). Additional sources: https://department.va.gov/wp-content/uploads/2025/06/2026-Budget-in-Brief.pdf | https://www.cbo.gov/publication/45615 | https://www.legion.org/information-center/news/veterans-healthcare/2025/june/va-budget-tops-400-billion-for-2025-from-higher-spending-on-mandated-benefits-medical-care
.
57.
Cybersecurity Ventures. Cybercrime economy projected to reach $10.5 trillion.
Cybersecurity Ventures: $10.5T Cybercrime https://cybersecurityventures.com/hackerpocalypse-cybercrime-report-2016/ (2016)
Global cybercrime costs: $3T (2015) → $6T (2021) → $10.5T (2025 projected) 15% annual growth rate If measured as country, would be 3rd largest economy after US and China Greatest transfer of economic wealth in history Note: More profitable than global trade of all major illegal drugs combined. Includes data theft, productivity loss, IP theft, fraud Additional sources: <https://cybersecurityventures.com/hackerpocalypse-cybercrime-report-2016/> | https://www.boisestate.edu/cybersecurity/2022/06/16/cybercrime-to-cost-the-world-10-5-trillion-annually-by-2025/
.
59.
Bolt, J. & Zanden, J. L. van.
Maddison project database 2020. (2020)
Historical GDP per capita estimates from year 1 to present. Global GDP per capita in 1900: approximately 1,260 in 1990 international dollars (roughly 3,150 in 2024 USD after PPP and inflation adjustment). Standard reference for long-run comparative economic history.
60.
Applied Clinical Trials. Global government spending on interventional clinical trials: $3-6 billion/year.
Applied Clinical Trials https://www.appliedclinicaltrialsonline.com/view/sizing-clinical-research-market Estimated range based on NIH ( $0.8-5.6B), NIHR ($1.6B total budget), and EU funding ( $1.3B/year). Roughly 5-10% of global market. Additional sources: https://www.appliedclinicaltrialsonline.com/view/sizing-clinical-research-market | https://www.thelancet.com/journals/langlo/article/PIIS2214-109X(20)30357-0/fulltext
.
65.
United Nations Department of Economic and Social Affairs, Population Division.
World population prospects 2024: Summary of results. (2024)
The 2024 Revision of the World Population Prospects provides population estimates and projections for 237 countries or areas. Global median age approximately 30.5 years in 2024, reflecting population-weighted average across all regions.
68.
Estimated from major foundation budgets and activities. Nonprofit clinical trial funding estimate.
Nonprofit foundations spend an estimated $2-5 billion annually on clinical trials globally, representing approximately 2-5% of total clinical trial spending.
69.
ICAN. Global nuclear weapon maintenance cost: $100 billion/year.
ICAN: Global Spending $100B 2024 https://www.icanw.org/global_spending_on_nuclear_weapons_topped_100_billion_in_2024 (2024)
2024: >$100 billion ($190,151/minute) - 11% increase ($9.9B) from 2023 Nine nuclear-armed states: China, France, India, Israel, N. Korea, Pakistan, Russia, UK, US US: $56.8B (more than all other 8 states combined); China: $12.5B; UK: $10B (+26% YoY, biggest increase) Historical trend: $72.9B (2019) → $82.4B (2021) → >$100B (2024) Private sector contracts: $463B ongoing; $42.5B earned from contracts in 2024 alone Note: $100B/year figure accurate for 2024. Rapid growth from $73B (2019). US spends more than rest of world combined on nuclear weapons Additional sources: https://www.icanw.org/global_spending_on_nuclear_weapons_topped_100_billion_in_2024 | https://www.icanw.org/the_cost_of_nuclear_weapons
.
70.
Industry reports: IQVIA. Global pharmaceutical r&d spending.
Total global pharmaceutical R&D spending is approximately $300 billion annually. Clinical trials represent 15-20% of this total ($45-60B), with the remainder going to drug discovery, preclinical research, regulatory affairs, and manufacturing development.
71.
UN. Global population reaches 8 billion.
UN: World Population 8 Billion Nov 15 2022 https://www.un.org/en/desa/world-population-reach-8-billion-15-november-2022 (2022)
Milestone: November 15, 2022 (UN World Population Prospects 2022) Day of Eight Billion" designated by UN Added 1 billion people in just 11 years (2011-2022) Growth rate: Slowest since 1950; fell under 1% in 2020 Future: 15 years to reach 9B (2037); projected peak 10.4B in 2080s Projections: 8.5B (2030), 9.7B (2050), 10.4B (2080-2100 plateau) Note: Milestone reached Nov 2022. Population growth slowing; will take longer to add next billion (15 years vs 11 years) Additional sources: https://www.un.org/en/desa/world-population-reach-8-billion-15-november-2022 | https://www.un.org/en/dayof8billion | https://en.wikipedia.org/wiki/Day_of_Eight_Billion
.
72.
Harvard Kennedy School. 3.5% participation tipping point.
Harvard Kennedy School https://www.hks.harvard.edu/centers/carr/publications/35-rule-how-small-minority-can-change-world (2020)
The research found that nonviolent campaigns were twice as likely to succeed as violent ones, and once 3.5% of the population were involved, they were always successful. Chenoweth and Maria Stephan studied the success rates of civil resistance efforts from 1900 to 2006, finding that nonviolent movements attracted, on average, four times as many participants as violent movements and were more likely to succeed. Key finding: Every campaign that mobilized at least 3.5% of the population in sustained protest was successful (in their 1900-2006 dataset) Note: The 3.5% figure is a descriptive statistic from historical analysis, not a guaranteed threshold. One exception (Bahrain 2011-2014 with 6%+ participation) has been identified. The rule applies to regime change, not policy change in democracies. Additional sources: https://www.hks.harvard.edu/centers/carr/publications/35-rule-how-small-minority-can-change-world | https://www.hks.harvard.edu/sites/default/files/2024-05/Erica%20Chenoweth_2020-005.pdf | https://www.bbc.com/future/article/20190513-it-only-takes-35-of-people-to-change-the-world | https://en.wikipedia.org/wiki/3.5%25_rule
.
73.
International IDEA.
International IDEA voter turnout database world export. (2026)
Best current register-based estimate of global registered voters. Sum of the latest available country-level Registration counts in International IDEA’s world export on 2026-04-22 = 4,128,142,495 registered voters across 199 countries and political entities. Methodology notes that Registration is the number of names on the voters’ register as reported by electoral management bodies, and comparability is imperfect because voter rolls and registration systems differ across countries. Additional sources: https://www.idea.int/data-tools/data/voter-turnout-database | https://www.idea.int/data-tools/export?type=region_only&themeId=293&world=all&loc=home
.
75.
Federation of American Scientists. World nuclear forces.
Federation of American Scientists https://fas.org/issues/nuclear-weapons/status-world-nuclear-forces/ (2024)
As of early 2025, we estimate that the world’s nine nuclear-armed states possess a combined total of approximately 12,241 nuclear warheads. Additional sources: https://fas.org/issues/nuclear-weapons/status-world-nuclear-forces/
.
76.
OpenSecrets.
Top lobbying industries 2025. (2025)
Sector ranks and per-company federal lobbying spending for 2025. Combined market capitalization of the top-5 publicly traded US lobbying spenders in each government-controlling sector: pharmaceuticals $1,794.7B; technology $13,279.5B; insurance $385.6B; oil and gas $1,246.9B; four-sector total approx $16.71T. Caveats: Meta (Zuckerberg holds 60.8% of voting power) and Alphabet (Page and Brin hold 52.3%) cannot be majority-acquired; Ellison owns 40.6% of Oracle; the largest insurance lobbyists are mutuals with no public shares; trade associations (PhRMA, AHIP, SIFMA, API) are not acquirable. Additional sources: https://stockanalysis.com/stocks/
.
77.
NHGRI. Human genome project and CRISPR discovery.
NHGRI https://www.genome.gov/11006929/2003-release-international-consortium-completes-hgp (2003)
Your DNA is 3 billion base pairs Read the entire code (Human Genome Project, completed 2003) Learned to edit it (CRISPR, discovered 2012) Additional sources: https://www.genome.gov/11006929/2003-release-international-consortium-completes-hgp | https://www.nobelprize.org/prizes/chemistry/2020/press-release/
.
78.
PMC. Only 12% of human interactome targeted.
PMC https://pmc.ncbi.nlm.nih.gov/articles/PMC10749231/ (2023)
Mapping 350,000+ clinical trials showed that only 12% of the human interactome has ever been targeted by drugs. Additional sources: https://pmc.ncbi.nlm.nih.gov/articles/PMC10749231/
.
79.
WHO. ICD-10 code count ( 14,000).
WHO https://icd.who.int/browse10/2019/en (2019)
The ICD-10 classification contains approximately 14,000 codes for diseases, signs and symptoms. Additional sources: https://icd.who.int/browse10/2019/en
.
81.
McFarland, M. J., Hauer, M. E. & Reuben, A.
Half of US population exposed to adverse lead levels in early childhood.
Proceedings of the National Academy of Sciences 119, e2118631119 (2022)
Leaded gasoline, used in the US from 1923 until its on-road ban in 1996, exposed more than half of the 2015 US population to adverse blood-lead levels in early childhood. The authors estimate childhood lead exposure cost the population a cumulative 824 million IQ points, an average of 2.6 points per person, rising to 5.9 points for the most-exposed 1966-1970 birth cohort.
82.
Wikipedia. Longevity escape velocity (LEV) - maximum human life extension potential.
Wikipedia: Longevity Escape Velocity https://en.wikipedia.org/wiki/Longevity_escape_velocity Longevity escape velocity: Hypothetical point where medical advances extend life expectancy faster than time passes Term coined by Aubrey de Grey (biogerontologist) in 2004 paper; concept from David Gobel (Methuselah Foundation) Current progress: Science adds 3 months to lifespan per year; LEV requires adding >1 year per year Sinclair (Harvard): "There is no biological upper limit to age" - first person to live to 150 may already be born De Grey: 50% chance of reaching LEV by mid-to-late 2030s; SENS approach = damage repair rather than slowing damage Kurzweil (2024): LEV by 2029-2035, AI will simulate biological processes to accelerate solutions George Church: LEV "in a decade or two" via age-reversal clinical trials Natural lifespan cap: 120-150 years (Jeanne Calment record: 122); engineering approach could bypass via damage repair Key mechanisms: Epigenetic reprogramming, senolytic drugs, stem cell therapy, gene therapy, AI-driven drug discovery Current record: Jeanne Calment (122 years, 164 days) - record unbroken since 1997 Note: LEV is theoretical but increasingly plausible given demonstrated age reversal in mice (109% lifespan extension) and human cells (30-year epigenetic age reversal) Additional sources: https://en.wikipedia.org/wiki/Longevity_escape_velocity | https://pmc.ncbi.nlm.nih.gov/articles/PMC423155/ | https://www.popularmechanics.com/science/a36712084/can-science-cure-death-longevity/ | https://www.diamandis.com/blog/longevity-escape-velocity
.
83.
OpenSecrets. Lobbyist statistics for washington d.c.
OpenSecrets: Lobbying in US https://en.wikipedia.org/wiki/Lobbying_in_the_United_States Registered lobbyists: Over 12,000 (some estimates); 12,281 registered (2013) Former government employees as lobbyists: 2,200+ former federal employees (1998-2004), including 273 former White House staffers, 250 former Congress members & agency heads Congressional revolving door: 43% (86 of 198) lawmakers who left 1998-2004 became lobbyists; currently 59% leaving to private sector work for lobbying/consulting firms/trade groups Executive branch: 8% were registered lobbyists at some point before/after government service Additional sources: https://en.wikipedia.org/wiki/Lobbying_in_the_United_States | https://www.opensecrets.org/revolving-door | https://www.citizen.org/article/revolving-congress/ | https://www.propublica.org/article/we-found-a-staggering-281-lobbyists-whove-worked-in-the-trump-administration
.
84.
MDPI Vaccines. Measles vaccination ROI.
MDPI Vaccines https://www.mdpi.com/2076-393X/12/11/1210 (2024)
Single measles vaccination: 167:1 benefit-cost ratio. MMR (measles-mumps-rubella) vaccination: 14:1 ROI. Historical US elimination efforts (1966-1974): benefit-cost ratio of 10.3:1 with net benefits exceeding USD 1.1 billion (1972 dollars, or USD 8.0 billion in 2023 dollars). 2-dose MMR programs show direct benefit/cost ratio of 14.2 with net savings of $5.3 billion, and 26.0 from societal perspectives with net savings of $11.6 billion. Additional sources: https://www.mdpi.com/2076-393X/12/11/1210 | https://www.tandfonline.com/doi/full/10.1080/14760584.2024.2367451
.
88.
U.S. Government Accountability Office.
Electronic Health Records: First Year of CMS’s Incentive Programs Shows Opportunities to Improve Processes to Verify Providers Met Requirements.
https://www.gao.gov/products/gao-12-481 (2012).
94.
Calculated from Orphanet Journal of Rare Diseases (2024). Diseases getting first effective treatment each year.
Calculated from Orphanet Journal of Rare Diseases (2024) https://ojrd.biomedcentral.com/articles/10.1186/s13023-024-03398-1 (2024)
Under the current system, approximately 10-15 diseases per year receive their FIRST effective treatment. Calculation: 5% of 7,000 rare diseases ( 350) have FDA-approved treatment, accumulated over 40 years of the Orphan Drug Act = 9 rare diseases/year. Adding 5-10 non-rare diseases that get first treatments yields 10-20 total. FDA approves 50 drugs/year, but many are for diseases that already have treatments (me-too drugs, second-line therapies). Only 15 represent truly FIRST treatments for previously untreatable conditions.
95.
NIH. NIH budget (FY 2025).
NIH https://www.nih.gov/about-nih/organization/budget (2024)
The budget total of $47.7 billion also includes $1.412 billion derived from PHS Evaluation financing... Additional sources: https://www.nih.gov/about-nih/organization/budget | https://officeofbudget.od.nih.gov/
.
96.
Bentley et al. NIH spending on clinical trials: 3.3%.
Bentley et al. https://pmc.ncbi.nlm.nih.gov/articles/PMC10349341/ (2023)
NIH spent $8.1 billion on clinical trials for approved drugs (2010-2019), representing 3.3% of relevant NIH spending. Additional sources: https://pmc.ncbi.nlm.nih.gov/articles/PMC10349341/ | https://catalyst.harvard.edu/news/article/nih-spent-8-1b-for-phased-clinical-trials-of-drugs-approved-2010-19-10-of-reported-industry-spending/
.
97.
PMC. Standard medical research ROI ($20k-$100k/QALY).
PMC: Cost-effectiveness Thresholds Used by Study Authors https://pmc.ncbi.nlm.nih.gov/articles/PMC10114019/ (1990)
Typical cost-effectiveness thresholds for medical interventions in rich countries range from $50,000 to $150,000 per QALY. The Institute for Clinical and Economic Review (ICER) uses a $100,000-$150,000/QALY threshold for value-based pricing. Between 1990-2021, authors increasingly cited $100,000 (47% by 2020-21) or $150,000 (24% by 2020-21) per QALY as benchmarks for cost-effectiveness. Additional sources: https://pmc.ncbi.nlm.nih.gov/articles/PMC10114019/ | https://icer.org/our-approach/methods-process/cost-effectiveness-the-qaly-and-the-evlyg/
.
98.
Xia et al., Nature Food. Nuclear winter famine.
Xia et al. https://www.nature.com/articles/s43016-022-00573-0 (2022)
We estimate that a nuclear war between the United States and Russia would produce 150 Tg of soot and lead to 5 billion people dying at the end of year 2. Additional sources: https://www.nature.com/articles/s43016-022-00573-0
.
99.
Manhattan Institute. RECOVERY trial 82× cost reduction.
Manhattan Institute: Slow Costly Trials https://manhattan.institute/article/slow-costly-clinical-trials-drag-down-biomedical-breakthroughs RECOVERY trial: $500 per patient ($20M for 48,000 patients = $417/patient) Typical clinical trial: $41,000 median per-patient cost Cost reduction: 80-82× cheaper ($41,000 ÷ $500 ≈ 82×) Efficiency: $50 per patient per answer (10 therapeutics tested, 4 effective) Dexamethasone estimated to save >630,000 lives Additional sources: https://manhattan.institute/article/slow-costly-clinical-trials-drag-down-biomedical-breakthroughs | https://pmc.ncbi.nlm.nih.gov/articles/PMC9293394/
.
100.
Trials. Patient willingness to participate in clinical trials.
Trials: Patients’ Willingness Survey https://trialsjournal.biomedcentral.com/articles/10.1186/s13063-015-1105-3 Recent surveys: 49-51% willingness (2020-2022) - dramatic drop from 85% (2019) during COVID-19 pandemic Cancer patients when approached: 88% consented to trials (Royal Marsden Hospital) Study type variation: 44.8% willing for drug trial, 76.2% for diagnostic study Top motivation: "Learning more about my health/medical condition" (67.4%) Top barrier: "Worry about experiencing side effects" (52.6%) Additional sources: https://trialsjournal.biomedcentral.com/articles/10.1186/s13063-015-1105-3 | https://www.appliedclinicaltrialsonline.com/view/industry-forced-to-rethink-patient-participation-in-trials | https://pmc.ncbi.nlm.nih.gov/articles/PMC7183682/
.
101.
The Commune. Pentagon audit failures ($2.46T unaccounted).
The Commune https://thecommunemag.com/the-pentagon-misplaced-2-46-trillion-an-in-depth-look-at-the-financial-audit-failures (2024)
In the most recent audit, the Department of Defense (DoD) could not account for approximately 60% of its \(4.1 trillion in assets, amounting to\)2.46 trillion unaccounted for. Alternative title: Pentagon unsupported accounting adjustments (\(6.5T, single year, US Army) In 2015, the Department of Defense's Inspector General reported that the Army could not adequately support\)6.5 trillion in year-end adjustments, indicating severe accounting discrepancies. Additional sources: https://thecommunemag.com/the-pentagon-misplaced-2-46-trillion-an-in-depth-look-at-the-financial-audit-failures | https://accmag.com/audit-pentagon-cannot-account-for-6-5-trillion-dollars-is-taxpayer-money/
.
102.
Tufts CSDD. Cost of drug development.
Various estimates suggest $1.0 - $2.5 billion to bring a new drug from discovery through FDA approval, spread across 10 years. Tufts Center for the Study of Drug Development often cited for $1.0 - $2.6 billion/drug. Industry reports (IQVIA, Deloitte) also highlight $2+ billion figures.
103.
Value in Health. Average lifetime revenue per successful drug.
Value in Health: Sales Revenues for New Therapeutic Agents https://www.sciencedirect.com/science/article/pii/S1098301524027542 Study of 361 FDA-approved drugs from 1995-2014 (median follow-up 13.2 years): Mean lifetime revenue: $15.2 billion per drug Median lifetime revenue: $6.7 billion per drug Revenue after 5 years: $3.2 billion (mean) Revenue after 10 years: $9.5 billion (mean) Revenue after 15 years: $19.2 billion (mean) Distribution highly skewed: top 25 drugs (7%) accounted for 38% of total revenue ($2.1T of $5.5T) Additional sources: https://www.sciencedirect.com/science/article/pii/S1098301524027542
.
104.
Lichtenberg, F. R.
How many life-years have new drugs saved? A three-way fixed-effects analysis of 66 diseases in 27 countries, 2000-2013.
International Health 11, 403–416 (2019)
Using 3-way fixed-effects methodology (disease-country-year) across 66 diseases in 22 countries, this study estimates that drugs launched after 1981 saved 148.7 million life-years in 2013 alone. The regression coefficients for drug launches 0-11 years prior (beta=-0.031, SE=0.008) and 12+ years prior (beta=-0.057, SE=0.013) on years of life lost are highly significant (p<0.0001). Confidence interval for life-years saved: 79.4M-239.8M (95 percent CI) based on propagated standard errors from Table 2.
105.
Deloitte. Pharmaceutical r&d return on investment (ROI).
Deloitte: Measuring Pharmaceutical Innovation 2025 https://www.deloitte.com/ch/en/Industries/life-sciences-health-care/research/measuring-return-from-pharmaceutical-innovation.html (2025)
Deloitte’s annual study of top 20 pharma companies by R&D spend (2010-2024): 2024 ROI: 5.9% (second year of growth after decade of decline) 2023 ROI: 4.3% (estimated from trend) 2022 ROI: 1.2% (historic low since study began, 13-year low) 2021 ROI: 6.8% (record high, inflated by COVID-19 vaccines/treatments) Long-term trend: Declining for over a decade before 2023 recovery Average R&D cost per asset: $2.3B (2022), $2.23B (2024) These returns (1.2-5.9% range) fall far below typical corporate ROI targets (15-20%) Additional sources: https://www.deloitte.com/ch/en/Industries/life-sciences-health-care/research/measuring-return-from-pharmaceutical-innovation.html | https://www.prnewswire.com/news-releases/deloittes-13th-annual-pharmaceutical-innovation-report-pharma-rd-return-on-investment-falls-in-post-pandemic-market-301738807.html | https://hitconsultant.net/2023/02/16/pharma-rd-roi-falls-to-lowest-level-in-13-years/
.
106.
Nature Reviews Drug Discovery. Drug trial success rate from phase i to approval.
Nature Reviews Drug Discovery: Clinical Success Rates https://www.nature.com/articles/nrd.2016.136 (2016)
Overall Phase I to approval: 10-12.8% (conventional wisdom 10%, studies show 12.8%) Recent decline: Average LOA now 6.7% for Phase I (2014-2023 data) Leading pharma companies: 14.3% average LOA (range 8-23%) Varies by therapeutic area: Oncology 3.4%, CNS/cardiovascular lowest at Phase III Phase-specific success: Phase I 47-54%, Phase II 28-34%, Phase III 55-70% Note: 12% figure accurate for historical average. Recent data shows decline to 6.7%, with Phase II as primary attrition point (28% success) Additional sources: https://www.nature.com/articles/nrd.2016.136 | https://pmc.ncbi.nlm.nih.gov/articles/PMC6409418/ | https://academic.oup.com/biostatistics/article/20/2/273/4817524
.
107.
SofproMed. Phase 3 cost per trial range.
SofproMed https://www.sofpromed.com/how-much-does-a-clinical-trial-cost Phase 3 clinical trials cost between $20 million and $282 million per trial, with significant variation by therapeutic area and trial complexity. Additional sources: https://www.sofpromed.com/how-much-does-a-clinical-trial-cost | https://www.cbo.gov/publication/57126
.
108.
Ramsberg, J. & Platt, R. Pragmatic trial cost per patient (median $97).
Learning Health Systems https://pmc.ncbi.nlm.nih.gov/articles/PMC6508852/ (2018)
Meta-analysis of 108 embedded pragmatic clinical trials (2006-2016). The median cost per patient was $97 (IQR $19–$478), based on 2015 dollars. 25% of trials cost <$19/patient; 10 trials exceeded $1,000/patient. U.S. studies median $187 vs non-U.S. median $27. Additional sources: https://pmc.ncbi.nlm.nih.gov/articles/PMC6508852/
.
109.
WHO. Polio vaccination ROI.
WHO https://www.who.int/news-room/feature-stories/detail/sustaining-polio-investments-offers-a-high-return (2019)
For every dollar spent, the return on investment is nearly US$ 39." Total investment cost of US$ 7.5 billion generates projected economic and social benefits of US$ 289.2 billion from sustaining polio assets and integrating them into expanded immunization, surveillance and emergency response programmes across 8 priority countries (Afghanistan, Iraq, Libya, Pakistan, Somalia, Sudan, Syria, Yemen). Additional sources: https://www.who.int/news-room/feature-stories/detail/sustaining-polio-investments-offers-a-high-return
.
110.
ICRC. International campaign to ban landmines (ICBL) - ottawa treaty (1997).
ICRC https://www.icrc.org/en/doc/resources/documents/article/other/57jpjn.htm (1997)
ICBL: Founded 1992 by 6 NGOs (Handicap International, Human Rights Watch, Medico International, Mines Advisory Group, Physicians for Human Rights, Vietnam Veterans of America Foundation) Started with ONE staff member: Jody Williams as founding coordinator Grew to 1,000+ organizations in 60 countries by 1997 Ottawa Process: 14 months (October 1996 - December 1997) Convention signed by 122 states on December 3, 1997; entered into force March 1, 1999 Achievement: Nobel Peace Prize 1997 (shared by ICBL and Jody Williams) Government funding context: Canada established $100M CAD Canadian Landmine Fund over 10 years (1997); International donors provided $169M in 1997 for mine action (up from $100M in 1996) Additional sources: https://www.icrc.org/en/doc/resources/documents/article/other/57jpjn.htm | https://en.wikipedia.org/wiki/International_Campaign_to_Ban_Landmines | https://www.nobelprize.org/prizes/peace/1997/summary/ | https://un.org/press/en/1999/19990520.MINES.BRF.html | https://www.the-monitor.org/en-gb/reports/2003/landmine-monitor-2003/mine-action-funding.aspx
.
111.
OpenSecrets.
Revolving door: Former members of congress. (2024)
388 former members of Congress are registered as lobbyists. Nearly 5,400 former congressional staffers have left Capitol Hill to become federal lobbyists in the past 10 years. Additional sources: https://www.opensecrets.org/revolving-door
.
112.
Kinch, M. S. & Griesenauer, R. H.
Lost medicines: A longer view of the pharmaceutical industry with the potential to reinvigorate discovery.
Drug Discovery Today 24, 875–880 (2019)
Research identified 1,600+ medicines available in 1962. The 1950s represented industry high-water mark with >30 new products in five of ten years; this rate would not be replicated until late 1990s. More than half (880) of these medicines were lost following implementation of Kefauver-Harris Amendment. The peak of 1962 would not be seen again until early 21st century. By 2016 number of organizations actively involved in R&D at level not seen since 1914.
113.
Baily, M. N. Pre-1962 drug development costs (baily 1972).
Baily (1972) https://samizdathealth.org/wp-content/uploads/2020/12/hlthaff.1.2.6.pdf (1972)
Pre-1962: Average cost per new chemical entity (NCE) was $6.5 million (1980 dollars) Inflation-adjusted to 2024 dollars: $6.5M (1980) ≈ $22.5M (2024), using CPI multiplier of 3.46× Real cost increase (inflation-adjusted): $22.5M (pre-1962) → $2,600M (2024) = 116× increase Note: This represents the most comprehensive academic estimate of pre-1962 drug development costs based on empirical industry data Additional sources: https://samizdathealth.org/wp-content/uploads/2020/12/hlthaff.1.2.6.pdf
.
114.
Think by Numbers. Pre-1962 physician-led clinical trials.
Think by Numbers: How Many Lives Does FDA Save? https://thinkbynumbers.org/health/how-many-net-lives-does-the-fda-save/ (1966)
Pre-1962: Physicians could report real-world evidence directly 1962 Drug Amendments replaced "premarket notification" with "premarket approval", requiring extensive efficacy testing Impact: New regulatory clampdown reduced new treatment production by 70%; lifespan growth declined from 4 years/decade to 2 years/decade Drug Efficacy Study Implementation (DESI): NAS/NRC evaluated 3,400+ drugs approved 1938-1962 for safety only; reviewed >3,000 products, >16,000 therapeutic claims FDA has had authority to accept real-world evidence since 1962, clarified by 21st Century Cures Act (2016) Note: Specific "144,000 physicians" figure not verified in sources Additional sources: https://thinkbynumbers.org/health/how-many-net-lives-does-the-fda-save/ | https://www.fda.gov/drugs/enforcement-activities-fda/drug-efficacy-study-implementation-desi | http://www.nasonline.org/about-nas/history/archives/collections/des-1966-1969-1.html
.
115.
GAO. 95% of diseases have 0 FDA-approved treatments.
GAO https://www.gao.gov/products/gao-25-106774 (2025)
95% of diseases have no treatment Additional sources: https://www.gao.gov/products/gao-25-106774 | https://globalgenes.org/rare-disease-facts/
.
117.
NHS England; Águas et al. RECOVERY trial global lives saved ( 1 million).
NHS England: 1 Million Lives Saved https://www.england.nhs.uk/2021/03/covid-treatment-developed-in-the-nhs-saves-a-million-lives/ (2021)
Dexamethasone saved 1 million lives worldwide (NHS England estimate, March 2021, 9 months after discovery). UK alone: 22,000 lives saved. Methodology: Águas et al. Nature Communications 2021 estimated 650,000 lives (range: 240,000-1,400,000) for July-December 2020 alone, based on RECOVERY trial mortality reductions (36% for ventilated, 18% for oxygen-only patients) applied to global COVID hospitalizations. June 2020 announcement: Dexamethasone reduced deaths by up to 1/3 (ventilated patients), 1/5 (oxygen patients). Impact immediate: Adopted into standard care globally within hours of announcement. Additional sources: https://www.england.nhs.uk/2021/03/covid-treatment-developed-in-the-nhs-saves-a-million-lives/ | https://www.nature.com/articles/s41467-021-21134-2 | https://pharmaceutical-journal.com/article/news/steroid-has-saved-the-lives-of-one-million-covid-19-patients-worldwide-figures-show | https://www.recoverytrial.net/news/recovery-trial-celebrates-two-year-anniversary-of-life-saving-dexamethasone-result
.
120.
National September 11 Memorial & Museum.
September 11 attack facts. (2024)
2,977 people were killed in the September 11, 2001 attacks: 2,753 at the World Trade Center, 184 at the Pentagon, and 40 passengers and crew on United Flight 93 in Shanksville, Pennsylvania.
121.
World Bank. World bank singapore economic data.
World Bank https://data.worldbank.org/country/singapore (2024)
Singapore GDP per capita (2023): $82,000 - among highest in the world Government spending: 15% of GDP (vs US 38%) Life expectancy: 84.1 years (vs US 77.5 years) Singapore demonstrates that low government spending can coexist with excellent outcomes Additional sources: https://data.worldbank.org/country/singapore
.
122.
International Monetary Fund.
IMF singapore government spending data. (2024)
Singapore government spending is approximately 15% of GDP This is 23 percentage points lower than the United States (38%) Despite lower spending, Singapore achieves excellent outcomes: - Life expectancy: 84.1 years (vs US 77.5) - Low crime, world-class infrastructure, AAA credit rating Additional sources: https://www.imf.org/en/Countries/SGP
.
123.
World Health Organization.
WHO life expectancy data by country. (2024)
Life expectancy at birth varies significantly among developed nations: Switzerland: 84.0 years (2023) Singapore: 84.1 years (2023) Japan: 84.3 years (2023) United States: 77.5 years (2023) - 6.5 years below Switzerland, Singapore Global average: 73 years Note: US spends more per capita on healthcare than any other nation, yet achieves lower life expectancy Additional sources: https://www.who.int/data/gho/data/themes/mortality-and-global-health-estimates/ghe-life-expectancy-and-healthy-life-expectancy
.
125.
PMC. Contribution of smoking reduction to life expectancy gains.
PMC: Benefits Smoking Cessation Longevity https://www.ncbi.nlm.nih.gov/pmc/articles/PMC1447499/ (2012)
Population-level: Up to 14% (9% men, 14% women) of total life expectancy gain since 1960 due to tobacco control efforts Individual cessation benefits: Quitting at age 35 adds 6.9-8.5 years (men), 6.1-7.7 years (women) vs continuing smokers By cessation age: Age 25-34 = 10 years gained; age 35-44 = 9 years; age 45-54 = 6 years; age 65 = 2.0 years (men), 3.7 years (women) Cessation before age 40: Reduces death risk by 90% Long-term cessation: 10+ years yields survival comparable to never smokers, averts 10 years of life lost Recent cessation: <3 years averts 5 years of life lost Additional sources: https://www.ncbi.nlm.nih.gov/pmc/articles/PMC1447499/ | https://www.cdc.gov/pcd/issues/2012/11_0295.htm | https://www.ajpmonline.org/article/S0749-3797(24)00217-4/fulltext | https://www.nejm.org/doi/full/10.1056/NEJMsa1211128
.
126.
ICER. Value per QALY (standard economic value).
ICER https://icer.org/wp-content/uploads/2024/02/Reference-Case-4.3.25.pdf (2024)
Standard economic value per QALY: $100,000–$150,000. This is the US and global standard willingness-to-pay threshold for interventions that add costs. Dominant interventions (those that save money while improving health) are favorable regardless of this threshold. Additional sources: https://icer.org/wp-content/uploads/2024/02/Reference-Case-4.3.25.pdf
.
127.
GAO. Annual cost of u.s. Sugar subsidies.
GAO: Sugar Program https://www.gao.gov/products/gao-24-106144 Consumer costs: $2.5-3.5 billion per year (GAO estimate) Net economic cost: $1 billion per year 2022: US consumers paid 2X world price for sugar Program costs $3-4 billion/year but no federal budget impact (costs passed directly to consumers via higher prices) Employment impact: 10,000-20,000 manufacturing jobs lost annually in sugar-reliant industries (confectionery, etc.) Multiple studies confirm: Sweetener Users Association ($2.9-3.5B), AEI ($2.4B consumer cost), Beghin & Elobeid ($2.9-3.5B consumer surplus) Additional sources: https://www.gao.gov/products/gao-24-106144 | https://www.heritage.org/agriculture/report/the-us-sugar-program-bad-consumers-bad-agriculture-and-bad-america | https://www.aei.org/articles/the-u-s-spends-4-billion-a-year-subsidizing-stalinist-style-domestic-sugar-production/
.
128.
World Bank. Swiss military budget as percentage of GDP.
World Bank: Military Expenditure https://data.worldbank.org/indicator/MS.MIL.XPND.GD.ZS?locations=CH 2023: 0.70272% of GDP (World Bank) 2024: CHF 5.95 billion official military spending When including militia system costs: 1% GDP (CHF 8.75B) Comparison: Near bottom in Europe; only Ireland, Malta, Moldova spend less (excluding microstates with no armies) Additional sources: https://data.worldbank.org/indicator/MS.MIL.XPND.GD.ZS?locations=CH | https://www.avenir-suisse.ch/en/blog-defence-spending-switzerland-is-in-better-shape-than-it-seems/ | https://tradingeconomics.com/switzerland/military-expenditure-percent-of-gdp-wb-data.html
.
129.
World Bank. Switzerland vs. US GDP per capita comparison.
World Bank: Switzerland GDP Per Capita https://data.worldbank.org/indicator/NY.GDP.PCAP.CD?locations=CH 2024 GDP per capita (PPP-adjusted): Switzerland $93,819 vs United States $75,492 Switzerland’s GDP per capita 24% higher than US when adjusted for purchasing power parity Nominal 2024: Switzerland $103,670 vs US $85,810 Additional sources: https://data.worldbank.org/indicator/NY.GDP.PCAP.CD?locations=CH | https://tradingeconomics.com/switzerland/gdp-per-capita-ppp | https://www.theglobaleconomy.com/USA/gdp_per_capita_ppp/
.
130.
OECD.
OECD government spending as percentage of GDP. (2024)
OECD government spending data shows significant variation among developed nations: United States: 38.0% of GDP (2023) Switzerland: 35.0% of GDP - 3 percentage points lower than US Singapore: 15.0% of GDP - 23 percentage points lower than US (per IMF data) OECD average: approximately 40% of GDP Additional sources: https://data.oecd.org/gga/general-government-spending.htm
.
131.
OECD.
OECD median household income comparison. (2024)
Median household disposable income varies significantly across OECD nations: United States: $77,500 (2023) Switzerland: $55,000 PPP-adjusted (lower nominal but comparable purchasing power) Singapore: $75,000 PPP-adjusted Additional sources: https://data.oecd.org/hha/household-disposable-income.htm
.
132.
Wikipedia. Thalidomide scandal: Worldwide cases and mortality.
Wikipedia https://en.wikipedia.org/wiki/Thalidomide_scandal The total number of embryos affected by the use of thalidomide during pregnancy is estimated at 10,000, of whom about 40% died around the time of birth. More than 10,000 children in 46 countries were born with deformities such as phocomelia. Additional sources: https://en.wikipedia.org/wiki/Thalidomide_scandal
.
133.
PLOS One. Health and quality of life of thalidomide survivors as they age.
PLOS One https://journals.plos.org/plosone/article?id=10.1371/journal.pone.0210222 (2019)
Study of thalidomide survivors documenting ongoing disability impacts, quality of life, and long-term health outcomes. Survivors (now in their 60s) continue to experience significant disability from limb deformities, organ damage, and other effects. Additional sources: https://journals.plos.org/plosone/article?id=10.1371/journal.pone.0210222
.
135.
FDA Study via NCBI. Trial costs, FDA study.
FDA Study via NCBI https://www.ncbi.nlm.nih.gov/pmc/articles/PMC6248200/ Overall, the 138 clinical trials had an estimated median (IQR) cost of $19.0 million ($12.2 million-$33.1 million)... The clinical trials cost a median (IQR) of $41,117 ($31,802-$82,362) per patient. Additional sources: https://www.ncbi.nlm.nih.gov/pmc/articles/PMC6248200/
.
136.
GBD 2019 Diseases and Injuries Collaborators.
Global burden of disease study 2019: Disability weights.
The Lancet 396, 1204–1222 (2020)
Disability weights for 235 health states used in Global Burden of Disease calculations. Weights range from 0 (perfect health) to 1 (death equivalent). Chronic conditions like diabetes (0.05-0.35), COPD (0.04-0.41), depression (0.15-0.66), and cardiovascular disease (0.04-0.57) show substantial variation by severity. Treatment typically reduces disability weights by 50-80 percent for manageable chronic conditions.
137.
WHO. Annual global economic burden of alzheimer’s and other dementias.
WHO: Dementia Fact Sheet https://www.who.int/news-room/fact-sheets/detail/dementia (2019)
Global cost: $1.3 trillion (2019 WHO-commissioned study) 50% from informal caregivers (family/friends, 5 hrs/day) 74% of costs in high-income countries despite 61% of patients in LMICs $818B (2010) → $1T (2018) → $1.3T (2019) - rapid growth Note: Costs increased 35% from 2010-2015 alone. Informal care represents massive hidden economic burden Additional sources: https://www.who.int/news-room/fact-sheets/detail/dementia | https://alz-journals.onlinelibrary.wiley.com/doi/10.1002/alz.12901
.
138.
JAMA Oncology. Annual global economic burden of cancer.
JAMA Oncology: Global Cost 2020-2050 https://jamanetwork.com/journals/jamaoncology/fullarticle/2801798 (2020)
2020-2050 projection: $25.2 trillion total ($840B/year average) 2010 annual cost: $1.16 trillion (direct costs only) Recent estimate: $3 trillion/year (all costs included) Top 5 cancers: lung (15.4%), colon/rectum (10.9%), breast (7.7%), liver (6.5%), leukemia (6.3%) Note: China/US account for 45% of global burden; 75% of deaths in LMICs but only 50.0% of economic cost Additional sources: https://jamanetwork.com/journals/jamaoncology/fullarticle/2801798 | https://www.nature.com/articles/d41586-023-00634-9
.
140.
Diabetes Care. Annual global economic burden of diabetes.
Diabetes Care: Global Economic Burden https://diabetesjournals.org/care/article/41/5/963/36522/Global-Economic-Burden-of-Diabetes-in-Adults 2015: $1.3 trillion (1.8% of global GDP) 2030 projections: $2.1T-2.5T depending on scenario IDF health expenditure: $760B (2019) → $845B (2045 projected) 2/3 direct medical costs ($857B), 1/3 indirect costs (lost productivity) Note: Costs growing rapidly; expected to exceed $2T by 2030 Additional sources: https://diabetesjournals.org/care/article/41/5/963/36522/Global-Economic-Burden-of-Diabetes-in-Adults | https://doi.org/10.1016/S2213-8587(17)30097-9
.
142.
World Bank, Bureau of Economic Analysis. US GDP 2024 ($28.78 trillion).
World Bank https://data.worldbank.org/indicator/NY.GDP.MKTP.CD?locations=US (2024)
US GDP reached $28.78 trillion in 2024, representing approximately 26% of global GDP. Additional sources: https://data.worldbank.org/indicator/NY.GDP.MKTP.CD?locations=US | https://www.bea.gov/news/2024/gross-domestic-product-fourth-quarter-and-year-2024-advance-estimate
.
143.
Environmental Working Group. US farm subsidy database and analysis.
Environmental Working Group https://farm.ewg.org/ (2024)
US agricultural subsidies total approximately $30 billion annually, but create much larger economic distortions. Top 10% of farms receive 78% of subsidies, benefits concentrated in commodity crops (corn, soy, wheat, cotton), environmental damage from monoculture incentivized, and overall deadweight loss estimated at $50-120 billion annually. Additional sources: https://farm.ewg.org/ | https://www.ers.usda.gov/topics/farm-economy/farm-sector-income-finances/government-payments-the-safety-net/
.
144.
Drug Policy Alliance.
The drug war by the numbers. (2021)
Since 1971, the war on drugs has cost the United States an estimated $1 trillion in enforcement. The federal drug control budget was $41 billion in 2022. Mass incarceration costs the U.S. at least $182 billion every year, with over $450 billion spent to incarcerate individuals on drug charges in federal prisons.
145.
International Monetary Fund.
IMF fossil fuel subsidies data: 2023 update. (2023)
Globally, fossil fuel subsidies were $7 trillion in 2022 or 7.1 percent of GDP. The United States subsidies totaled $649 billion. Underpricing for local air pollution costs and climate damages are the largest contributor, accounting for about 30 percent each.
146.
Papanicolas, Irene et al. Health care spending in the united states and other high-income countries.
Papanicolas et al. https://jamanetwork.com/journals/jama/article-abstract/2674671 (2018)
The US spent approximately twice as much as other high-income countries on medical care (mean per capita: $9,892 vs $5,289), with similar utilization but much higher prices. Administrative costs accounted for 8% of US spending vs 1-3% in other countries. US spending on pharmaceuticals was $1,443 per capita vs $749 elsewhere. Despite spending more, US health outcomes are not better. Additional sources: https://jamanetwork.com/journals/jama/article-abstract/2674671
.
147.
Hsieh, C.-T. & Moretti, E. Housing constraints and spatial misallocation.
American Economic Journal: Macroeconomics https://www.aeaweb.org/articles?id=10.1257/mac.20170388 (2019)
We quantify the amount of spatial misallocation of labor across US cities and its aggregate costs. Tight land-use restrictions in high-productivity cities like New York, San Francisco, and Boston lowered aggregate US growth by 36% from 1964 to 2009. Local constraints on housing supply have had enormous effects on the national economy. Additional sources: https://www.aeaweb.org/articles?id=10.1257/mac.20170388
.
149.
Tax Foundation. Tax compliance costs the US economy $546 billion annually.
https://taxfoundation.org/data/all/federal/irs-tax-compliance-costs/ (2024)
Americans will spend over 7.9 billion hours complying with IRS tax filing and reporting requirements in 2024. This costs the economy roughly $413 billion in lost productivity. In addition, the IRS estimates that Americans spend roughly $133 billion annually in out-of-pocket costs, bringing the total compliance costs to $546 billion, or nearly 2 percent of GDP.
150.
Cook, C., Cole, G., Asaria, P., Jabbour, R. & Francis, D. P. Annual global economic burden of heart disease.
International Journal of Cardiology https://www.internationaljournalofcardiology.com/article/S0167-5273(13)02238-9/abstract (2014)
Heart failure alone: $108 billion/year (2012 global analysis, 197 countries) US CVD: $555B (2016) → projected $1.8T by 2050 LMICs total CVD loss: $3.7T cumulative (2011-2015, 5-year period) CVD is costliest disease category in most developed nations Note: No single $2.1T global figure found; estimates vary widely by scope and year Additional sources: https://www.ahajournals.org/doi/10.1161/CIR.0000000000001258
.
151.
Source: US Life Expectancy FDA Budget 1543-2019 CSV.
US life expectancy growth 1880-1960: 3.82 years per decade. (2019)
Pre-1962: 3.82 years/decade Post-1962: 1.54 years/decade Reduction: 60% decline in life expectancy growth rate Additional sources: https://ourworldindata.org/life-expectancy | https://www.mortality.org/ | https://www.cdc.gov/nchs/nvss/mortality_tables.htm
.
152.
Source: US Life Expectancy FDA Budget 1543-2019 CSV.
Post-1962 slowdown in life expectancy gains. (2019)
Pre-1962 (1880-1960): 3.82 years/decade Post-1962 (1962-2019): 1.54 years/decade Reduction: 60% decline Temporal correlation: Slowdown occurred immediately after 1962 Kefauver-Harris Amendment Additional sources: https://ourworldindata.org/life-expectancy | https://www.mortality.org/ | https://www.cdc.gov/nchs/nvss/mortality_tables.htm
.
153.
Centers for Disease Control and Prevention.
US life expectancy 2023. (2024)
US life expectancy at birth was 77.5 years in 2023 Male life expectancy: 74.8 years Female life expectancy: 80.2 years This is 6-7 years lower than peer developed nations despite higher healthcare spending Additional sources: https://www.cdc.gov/nchs/fastats/life-expectancy.htm
.
154.
US Census Bureau.
US median household income 2023. (2024)
US median household income was $77,500 in 2023 Real median household income declined 0.8% from 2022 Gini index: 0.467 (income inequality measure) Additional sources: https://www.census.gov/library/publications/2024/demo/p60-282.html
.
155.
Manuel, D. U.s. Defense spending history: 100 years of military budgets.
DaveManuel.com https://www.davemanuel.com/us-defense-spending-history-military-budget-data.php (2025)
US military spending in constant 2024 dollars: 1939 $29B (pre-WW2 baseline), 1940 $37B, 1944 $1,383B, 1945 $1,420B (peak), 1946 $674B, 1947 $176B, 1948 $117B, 2024 $886B. The post-WW2 demobilization cut spending 88% in two years (1945-1947). Current peacetime spending ($886B) is 30x the pre-WW2 baseline and 62% of peak WW2 spending, in inflation-adjusted dollars.
156.
Statista. US military budget as percentage of GDP.
Statista https://www.statista.com/statistics/262742/countries-with-the-highest-military-spending/ (2024)
U.S. military spending amounted to 3.5% of GDP in 2024. In 2024, the U.S. spent nearly $1 trillion on its military budget, equal to 3.4% of GDP. Additional sources: https://www.statista.com/statistics/262742/countries-with-the-highest-military-spending/ | https://www.sipri.org/sites/default/files/2025-04/2504_fs_milex_2024.pdf
.
157.
US Census Bureau. Number of registered or eligible voters in the u.s.
US Census Bureau https://www.census.gov/newsroom/press-releases/2025/2024-presidential-election-voting-registration-tables.html (2024)
73.6% (or 174 million people) of the citizen voting-age population was registered to vote in 2024 (Census Bureau). More than 211 million citizens were active registered voters (86.6% of citizen voting age population) according to the Election Assistance Commission. Additional sources: https://www.census.gov/newsroom/press-releases/2025/2024-presidential-election-voting-registration-tables.html | https://www.eac.gov/news/2025/06/30/us-election-assistance-commission-releases-2024-election-administration-and-voting
.
158.
U.S. Senate. Treaties.
U.S. Senate https://www.senate.gov/about/powers-procedures/treaties.htm The Constitution provides that the president ’shall have Power, by and with the Advice and Consent of the Senate, to make Treaties, provided two-thirds of the Senators present concur’ (Article II, section 2). Treaties are formal agreements with foreign nations that require two-thirds Senate approval. 67 senators (two-thirds of 100) must vote to ratify a treaty for it to take effect. Additional sources: https://www.senate.gov/about/powers-procedures/treaties.htm
.
160.
Federal Election Commission.
Statistical summary of 24-month campaign activity of the 2023-2024 election cycle. (2023)
Presidential candidates raised $2 billion; House and Senate candidates raised $3.8 billion and spent $3.7 billion; PACs raised $15.7 billion and spent $15.5 billion. Total federal campaign spending approximately $20 billion. Additional sources: https://www.fec.gov/updates/statistical-summary-of-24-month-campaign-activity-of-the-2023-2024-election-cycle/
.
161.
OpenSecrets.
Federal lobbying hit record $4.4 billion in 2024. (2024)
Total federal lobbying reached record $4.4 billion in 2024. The $150 million increase in lobbying continues an upward trend that began in 2016. Additional sources: https://www.opensecrets.org/news/2025/02/federal-lobbying-set-new-record-in-2024/
.
162.
Columbia/NBER. Odds of a single vote being decisive in a u.s. Presidential election.
Columbia/NBER: What Is the Probability Your Vote Will Make a Difference? https://sites.stat.columbia.edu/gelman/research/published/probdecisive2.pdf (2012)
National average: 1 in 60 million chance (2008 election analysis by Gelman, Silver, Edlin) Swing states (NM, VA, NH, CO): 1 in 10 million chance Non-competitive states: 34 states >1 in 100 million odds; 20 states >1 in 1 billion Washington DC: 1 in 490 billion odds Methodology: Probability state is necessary for electoral college win × probability state vote is tied Additional sources: https://sites.stat.columbia.edu/gelman/research/published/probdecisive2.pdf | https://onlinelibrary.wiley.com/doi/abs/10.1111/j.1465-7295.2010.00272.x
.
163.
Hutchinson and Kirk.
Valley of death in drug development. (2011)
The overall failure rate of drugs that passed into Phase 1 trials to final approval is 90%. This lack of translation from promising preclinical findings to success in human trials is known as the "valley of death." Estimated 30-50% of promising compounds never proceed to Phase 2/3 trials primarily due to funding barriers rather than scientific failure. The late-stage attrition rate for oncology drugs is as high as 70% in Phase II and 59% in Phase III trials.
164.
DOT. DOT value of statistical life ($13.6M).
DOT: VSL Guidance 2024 https://www.transportation.gov/office-policy/transportation-policy/revised-departmental-guidance-on-valuation-of-a-statistical-life-in-economic-analysis (2024)
Current VSL (2024): $13.7 million (updated from $13.6M) Used in cost-benefit analyses for transportation regulations and infrastructure Methodology updated in 2013 guidance, adjusted annually for inflation and real income VSL represents aggregate willingness to pay for safety improvements that reduce fatalities by one Note: DOT has published VSL guidance periodically since 1993. Current $13.7M reflects 2024 inflation/income adjustments Additional sources: https://www.transportation.gov/office-policy/transportation-policy/revised-departmental-guidance-on-valuation-of-a-statistical-life-in-economic-analysis | https://www.transportation.gov/regulations/economic-values-used-in-analysis
.
165.
PLOS ONE. Cost per DALY for vitamin a supplementation.
PLOS ONE: Cost-effectiveness of "Golden Mustard" for Treating Vitamin A Deficiency in India (2010) https://journals.plos.org/plosone/article?id=10.1371/journal.pone.0012046 (2010)
India: $23-$50 per DALY averted (least costly intervention, $1,000-$6,100 per death averted) Sub-Saharan Africa (2022): $220-$860 per DALY (Burkina Faso: $220, Kenya: $550, Nigeria: $860) WHO estimates for Africa: $40 per DALY for fortification, $255 for supplementation Uganda fortification: $18-$82 per DALY (oil: $18, sugar: $82) Note: Wide variation reflects differences in baseline VAD prevalence, coverage levels, and whether intervention is supplementation or fortification Additional sources: https://journals.plos.org/plosone/article?id=10.1371/journal.pone.0012046 | https://journals.plos.org/plosone/article?id=10.1371/journal.pone.0266495
.
168.
PMC. Cost-effectiveness threshold ($50,000/QALY).
PMC https://pmc.ncbi.nlm.nih.gov/articles/PMC5193154/ The $50,000/QALY threshold is widely used in US health economics literature, originating from dialysis cost benchmarks in the 1980s. In US cost-utility analyses, 77.5% of authors use either $50,000 or $100,000 per QALY as reference points. Most successful health programs cost $3,000-10,000 per QALY. WHO-CHOICE uses GDP per capita multiples (1× GDP/capita = "very cost-effective", 3× GDP/capita = "cost-effective"), which for the US ( $70,000 GDP/capita) translates to $70,000-$210,000/QALY thresholds. Additional sources: https://pmc.ncbi.nlm.nih.gov/articles/PMC5193154/ | https://pmc.ncbi.nlm.nih.gov/articles/PMC9278384/
.
169.
Integrated Benefits Institute. Chronic illness workforce productivity loss.
Integrated Benefits Institute 2024 https://www.ibiweb.org/resources/chronic-conditions-in-the-us-workforce-prevalence-trends-and-productivity-impacts (2024)
78.4% of U.S. employees have at least one chronic condition (7% increase since 2021) 58% of employees report physical chronic health conditions 28% of all employees experience productivity loss due to chronic conditions Average productivity loss: $4,798 per employee per year Employees with 3+ chronic conditions miss 7.8 days annually vs 2.2 days for those without Note: 28% productivity loss translates to roughly 11 hours per week (28% of 40-hour workweek) Additional sources: https://www.ibiweb.org/resources/chronic-conditions-in-the-us-workforce-prevalence-trends-and-productivity-impacts | https://www.onemedical.com/mediacenter/study-finds-more-than-half-of-employees-are-living-with-chronic-conditions-including-1-in-3-gen-z-and-millennial-employees/ | https://debeaumont.org/news/2025/poll-the-toll-of-chronic-health-conditions-on-employees-and-workplaces/
.
171.
Gates, D.
The Napoleonic Wars 1803-1815. (Pimlico, 2003).
Estimates approximately 5 million total deaths in the Napoleonic Wars, including military and civilian casualties across all belligerents.
172.
Daggett, S.
Costs of major u.s. wars. (2010)
Congressional Research Service estimates of the costs of major U.S. wars from the American Revolution through post-9/11 operations, in both current-year and constant FY2011 dollars.
173.
Hacker, J. D.
A census-based count of the civil war dead.
Civil War History 57, 307–348 (2011)
Revised estimate of Civil War deaths to approximately 750,000, significantly higher than the traditional estimate of 620,000.
174.
Encyclopaedia Britannica.
World war i - killed, wounded, and missing. (2025)
Some 8,500,000 soldiers died as a result of wounds and/or disease. Civilian deaths were estimated at around 13,000,000, resulting from starvation, exposure, disease, military encounters, and massacres.
176.
Encyclopaedia Britannica.
Korean war. (2025)
At least 2.5 million persons lost their lives in the Korean War, encompassing military and civilian casualties across all combatant nations.
177.
Encyclopaedia Britannica.
How many people died in the vietnam war? (2025)
Vietnam’s 1995 official estimate: as many as 2 million civilians on both sides, 1.1 million North Vietnamese and Viet Cong fighters, plus nearly 300,000 South Vietnamese and allied soldiers. Total approximately 3.4 million.
179.
Crawford, N. C.
Human costs of post-9/11 wars. (2024)
Over 940,000 people killed by direct war violence. An estimated 3.6-3.8 million died indirectly in post-9/11 war zones. Total: at least 4.5-4.7 million and counting.
181.
Institute for Economics & Peace.
Global peace index 2024. (2024)
Institute for Economics and Peace Global Peace Index 2024. The economic impact of violence on the global economy reached nearly $20 trillion, with military spending and internal security costs accounting for 74% of the total.
182.
London Bullion Market Association.
Gold during periods of conflict. (2019)
During wartime, almost all belligerent nations would go off the gold standard in order to conceal the staggering costs of war from their citizens by printing money rather than raising taxes.
183.
Encyclopaedia Britannica.
Spanish-american war. (2025)
The Spanish-American War lasted from April to August 1898. American combat deaths totaled 345, though approximately 2,000 more died of disease. The war lasted approximately ten weeks.
187.
Crestmont Research.
Real GDP growth by decade. (2024)
Average real GDP growth by decade. 1950s: 4.2% per year. 1960s: 4.5% per year. 1970s: 3.2%. 1980s: 3.1%. 1990s: 3.2%. 2000s: 1.9%. 2010s: 2.3%.
188.
U.S. Census Bureau.
Historical census of housing tables: homeownership. (2024)
Homeownership rates by decade from decennial census data. 1940: 43.6%. 1950: 55.0%. 1960: 61.9%. 1970: 62.9%. The aggregate US homeownership rate increased by 20 percentage points from 1940 to 1960, the largest change in American homeownership in the past 100 years.
189.
Bordo, M. D. & Filardo, A.
Deflation in a Historical Perspective.
https://www.bis.org/publ/work186.pdf (2005)
Historical analysis of deflation episodes from the classical gold standard era through the post-WWII period. The "Great Deflation" of 1870-1896 saw prices fall roughly 2% per year while real output grew 2-3% per year. Good deflation occurs when aggregate supply increases faster than aggregate demand due to technological advances and productivity gains.
190.
Borio, C., Erdem, M., Filardo, A. & Hofmann, B. The costs of deflations: A historical perspective.
BIS Quarterly Review https://www.bis.org/publ/qtrpdf/r_qt1503e.htm (2015)
Tested the historical link between output growth and deflation across 140 years and up to 38 economies. Found the link is "weak" and "derives largely from the Great Depression." The benign output performance during the classical gold standard period characterized those deflations as "good." Property price deflations, not goods price deflations, are the more consistent predictor of economic weakness.
191.
Bordo, M. D., Redish, A. & Rockoff, H.
Why didn’t canada have a banking crisis in 2008 (or in 1930, or 1907, or ...)? The Economic History Review 68, 218–243 (2015)
Canada did not have a banking crisis in 2008 or during the Great Depression. Examines factors behind Canada’s record of banking stability, finding that the branch banking structure (few large banks with nationwide branches vs. thousands of small unit banks in the US) and regulatory framework were key contributors.
194.
Batty, M., Deeken, E. & Henriques Volz, A.
Wealth inequality and COVID-19: Evidence from the distributional financial accounts. (2021)
Nearly 90% of top 1% wealth gain during the COVID-19 rebound (2020Q1 to 2021Q1) came from corporate equities. Only one-third of bottom 50% households own any public equity. Households gained over $18 trillion in wealth since the beginning of 2020, with asset-price increases accounting for nearly 80% of wealth accumulation.
196.
ABC News.
Bailed-out banks gave millions in exec bonuses, NY AG report shows. (2009)
Citigroup lost $18.7 billion in 2008 and received $45 billion in TARP bailout funds, yet paid $5.33 billion in bonuses, with 738 employees receiving at least $1 million. Bank of America received $45 billion in TARP and paid $3.3 billion in bonuses. Merrill Lynch lost $30.48 billion and paid $3.6 billion in bonuses with 696 million-dollar recipients. Across nine major banks, nearly 4,800 employees received bonuses of $1 million or more.
197.
CBS News.
Study: Bank bonuses far exceeded profits. (2009)
Goldman Sachs earned $2.3 billion and paid out $4.8 billion in bonuses. Morgan Stanley earned $1.7 billion and paid $4.475 billion in bonuses. Citigroup and Merrill Lynch lost a combined $54 billion yet paid $9 billion in combined bonuses.
200.
Macrotrends.
Gold prices - 100 year historical chart. (2026)
Historical gold prices from 1915 to present. Average annual gold price in 1972: $58.17 per troy ounce. Gold price in early March 2026: over $5,400 per ounce.
201.
Economic Policy Institute.
The productivity-pay gap. (2024)
Since 1979, net productivity has grown 64.6% while hourly compensation of production and nonsupervisory workers grew just 14.8%. If workers’ pay had kept pace with productivity, the median worker would earn approximately $10,000 more per year.
202.
Nobel Prize Organization.
The prize in economic sciences. (2026)
The Nobel Prize website states: "The prize in economic sciences is not a Nobel Prize." The Sveriges Riksbank Prize in Economic Sciences in Memory of Alfred Nobel was established in 1968 by Sweden’s central bank, 67 years after the original Nobel Prizes.
203.
Nobel, P.
The nobel family dissociates itself from the economics prize. (2010)
Peter Nobel, Alfred Nobel’s great-grandnephew, called the economics prize "a PR coup by economists to improve their reputation" and stated that Nobel "despised people who cared more about profits than society’s well-being." Originally published on SVT Debatt, October 11, 2010.
206.
Suskind, R.
Confidence Men: Wall Street, Washington, and the Education of a President. (Harper, 2011).
Chapter 12, p. 289: Volcker quote on civil engineers vs. financial engineers.
208.
Sinn, M. P.
The 1% Treaty: An Incentive-Compatible Approach to Ending War and Disease.
https://manual.warondisease.org/knowledge/economics/1-pct-treaty-impact.html (2025) doi:
10.5281/zenodo.18161560 6.65 thousand diseases have zero FDA-approved treatments; at current trial capacity, exploring them takes 443 years. Redirecting 1% of military spending scales capacity 12.3x, cutting the timeline to 36 years and preventing 10.7 billion deaths. At $0.00177/DALY, 50.3kx more cost-effective than the best existing interventions. Incentive Alignment Bonds make adoption politically viable.